> ## Documentation Index
> Fetch the complete documentation index at: https://anvil.servicetitan.com/llms.txt
> Use this file to discover all available pages before exploring further.

# Categorical Color Palette

> Our solution for visualizations with 5+ variables.

export const DoDont = ({text, type, children}) => {
  return <>
      {type === "do" && <div className="do-dont do">
          {children && <div className="do-dont-content">{children}</div>}
          <Check>
            <p>
              <strong>Do</strong>
              {text && <span className="m-inline-start-1">{text}</span>}
            </p>
          </Check>
        </div>}
      {type === "dont" && <div className="do-dont dont">
          {children && <div className="do-dont-content">{children}</div>}
          <Danger>
            <p>
              <strong>Don't</strong>
              {text && <span className="m-inline-start-1">{text}</span>}
            </p>
          </Danger>
        </div>}
      {type === "caution" && <div className="do-dont caution">
          {children && <div className="do-dont-content">{children}</div>}
          <Warning>
            <p>
              <strong>Caution</strong>
              {text && <span className="m-inline-start-1">{text}</span>}
            </p>
          </Warning>
        </div>}
    </>;
};

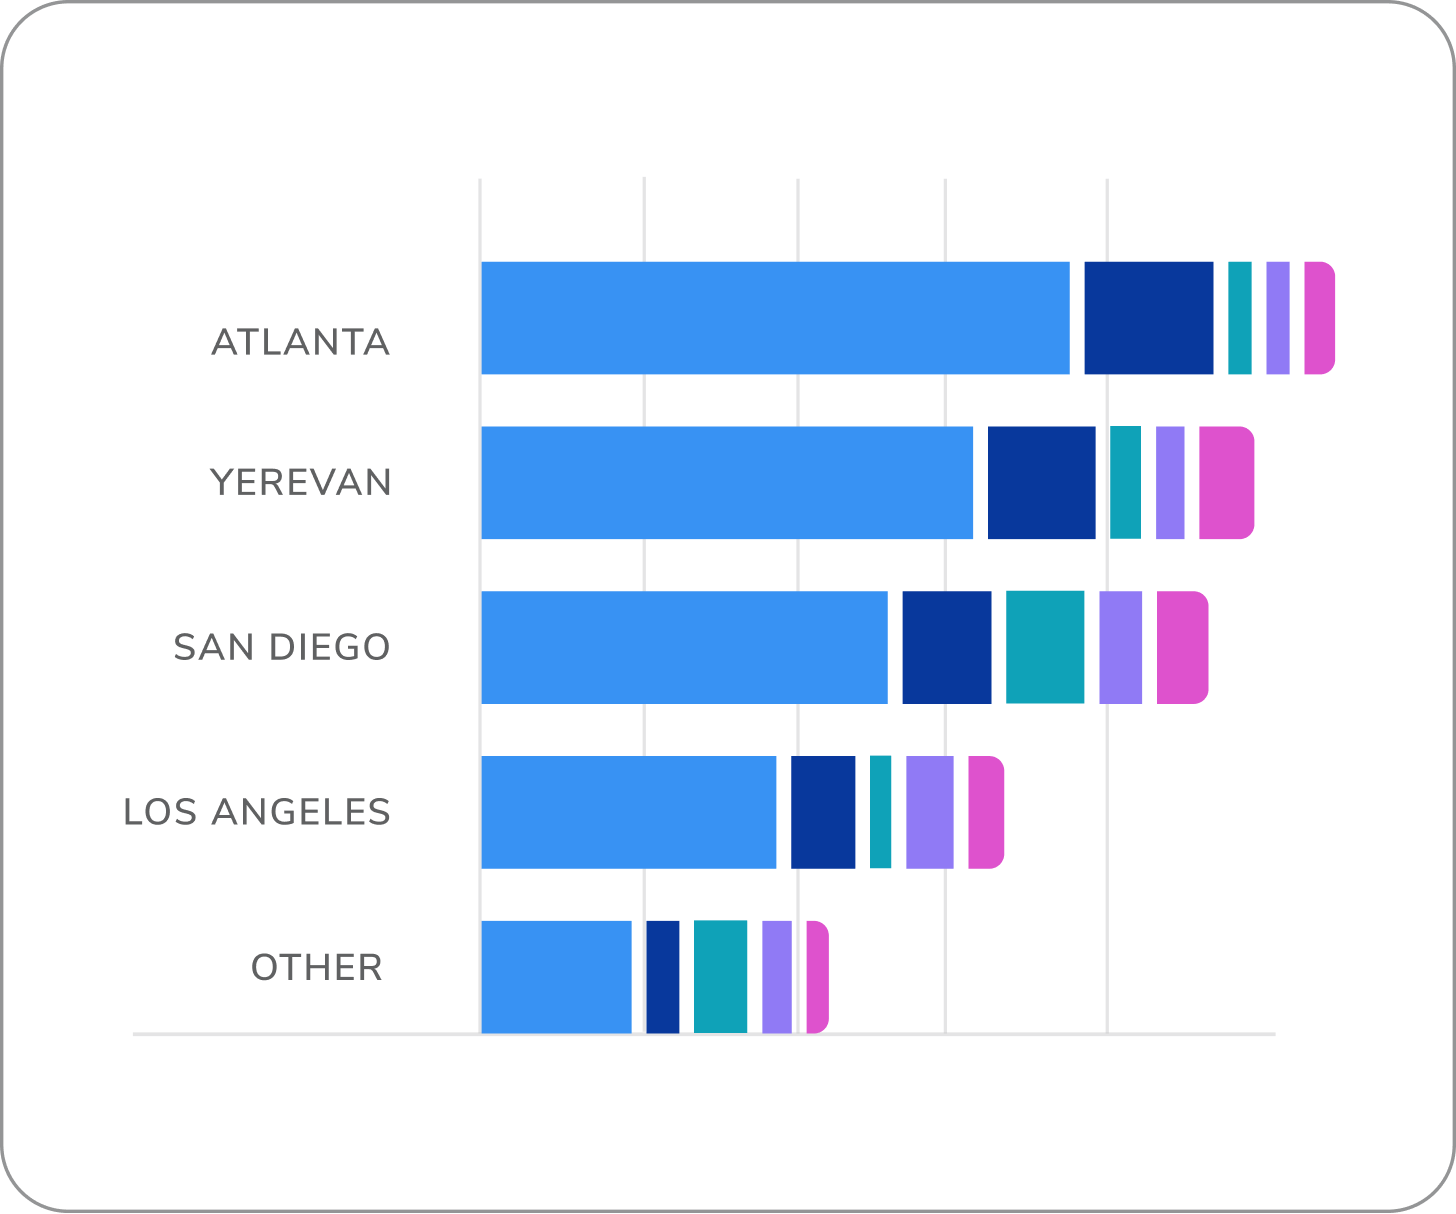
**Utilize these colors in the order shown below.** For example, the first 3
variables in your data set must use blue, cyan, and purple, for visual
consistency across the experience.

Accessibility requirement: when using this palette, you must include a direct
labeling option on your visualization.

#### Light Mode

<img src="https://mintcdn.com/servicetitan/mzb8vUC8QRJt2y_W/images/docs/web/data-visualization/categorical-color-palette/categorical-light-mode.png?fit=max&auto=format&n=mzb8vUC8QRJt2y_W&q=85&s=ee6181ce4bf3e08e213c11d4e2b372b8" alt="categorical light mode" width="2544" height="454" data-path="images/docs/web/data-visualization/categorical-color-palette/categorical-light-mode.png" />

#### Dark mode

<img src="https://mintcdn.com/servicetitan/mzb8vUC8QRJt2y_W/images/docs/web/data-visualization/categorical-color-palette/categorical-dark-mode.png?fit=max&auto=format&n=mzb8vUC8QRJt2y_W&q=85&s=eca73757fff3222098038c5d9d27e025" alt="categorical dark mode" width="2544" height="454" data-path="images/docs/web/data-visualization/categorical-color-palette/categorical-dark-mode.png" />

<Columns cols={2}>
  <img
    src="https://mintcdn.com/servicetitan/mzb8vUC8QRJt2y_W/images/docs/web/data-visualization/categorical-color-palette/categorical-example.png?fit=max&auto=format&n=mzb8vUC8QRJt2y_W&q=85&s=ca0e6e500ca8b29c43823d8a92faf524"
    alt="bar chart using categorical color
palette"
    width="1456"
    height="1214"
    data-path="images/docs/web/data-visualization/categorical-color-palette/categorical-example.png"
  />
</Columns>

### How to Use

<Columns cols={2}>
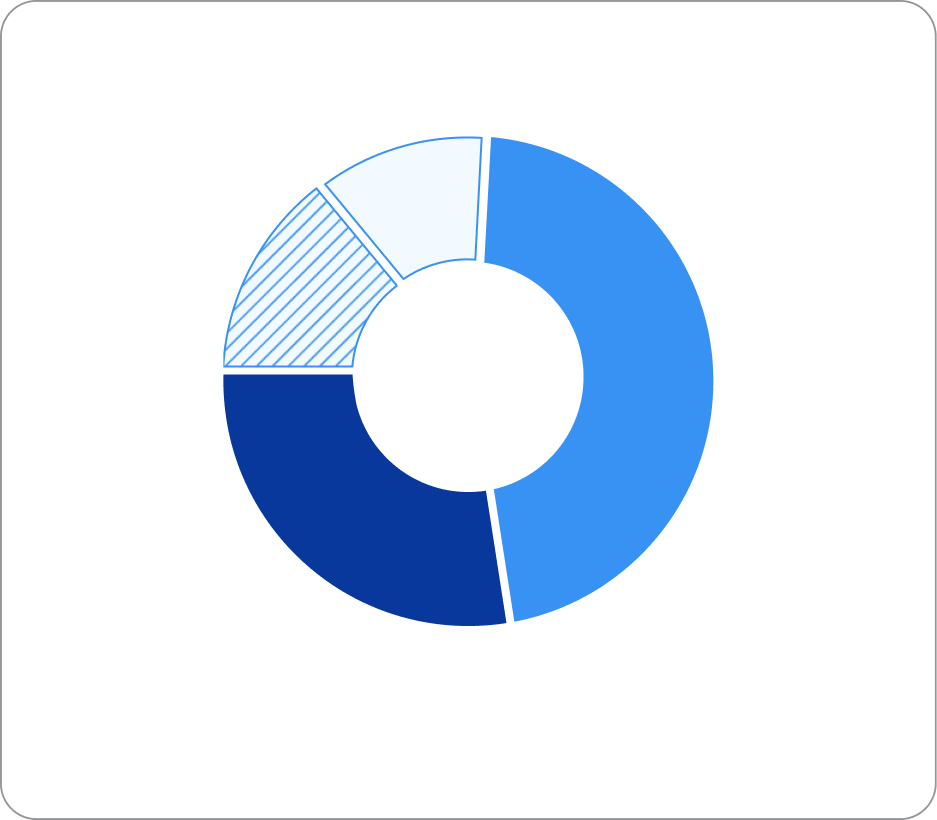
  <DoDont type="do" text="keep your data visualizations to 4 variables max">
    <img src="https://mintcdn.com/servicetitan/mzb8vUC8QRJt2y_W/images/docs/web/data-visualization/categorical-color-palette/categorical-do-4-variables.png?fit=max&auto=format&n=mzb8vUC8QRJt2y_W&q=85&s=d67eb4deda6882496a9a34b59458bc10" alt="donut chart using 4 variables" className="m-block-end-0 m-block-start-10" width="937" height="820" data-path="images/docs/web/data-visualization/categorical-color-palette/categorical-do-4-variables.png" />
  </DoDont>

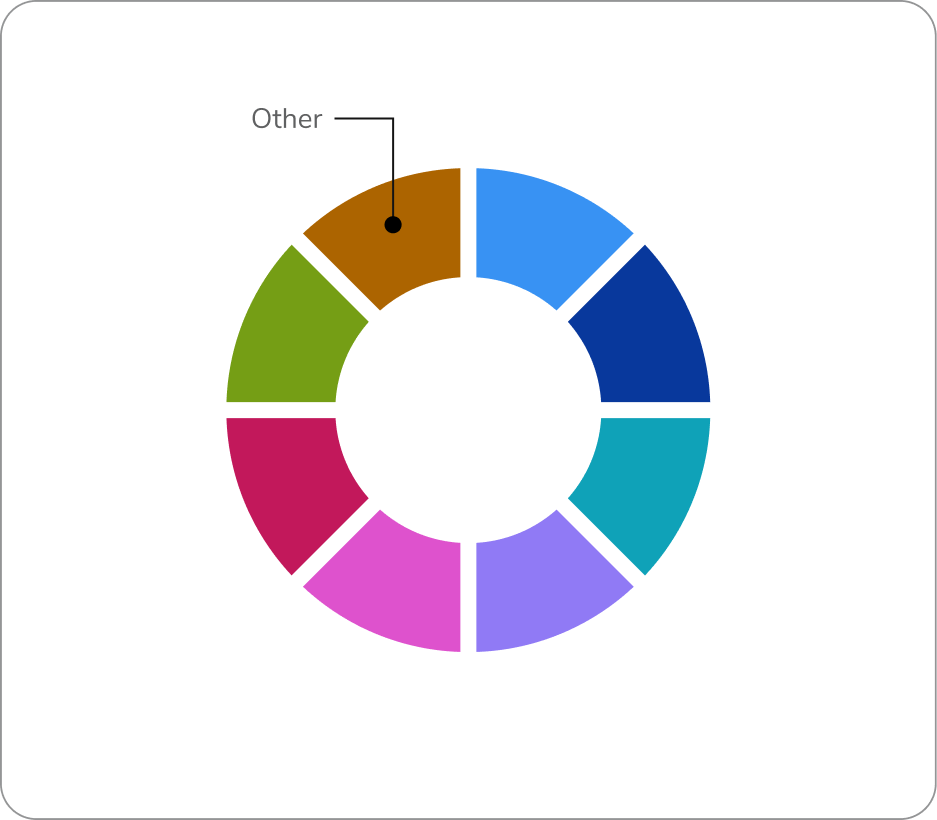
  <DoDont type="do" text="use the categorical color palette to clearly show up to 9 categories, grouping extras into an “Other” category and avoiding repeated colors to maintain clarity and consistency.">
    <img src="https://mintcdn.com/servicetitan/mzb8vUC8QRJt2y_W/images/docs/web/data-visualization/categorical-color-palette/categorical-do-9-categories.png?fit=max&auto=format&n=mzb8vUC8QRJt2y_W&q=85&s=6bda62a1916352fd55ba2d8ec00551b5" alt="donut chart with 9 variables" className="m-block-0" width="937" height="820" data-path="images/docs/web/data-visualization/categorical-color-palette/categorical-do-9-categories.png" />
  </DoDont>

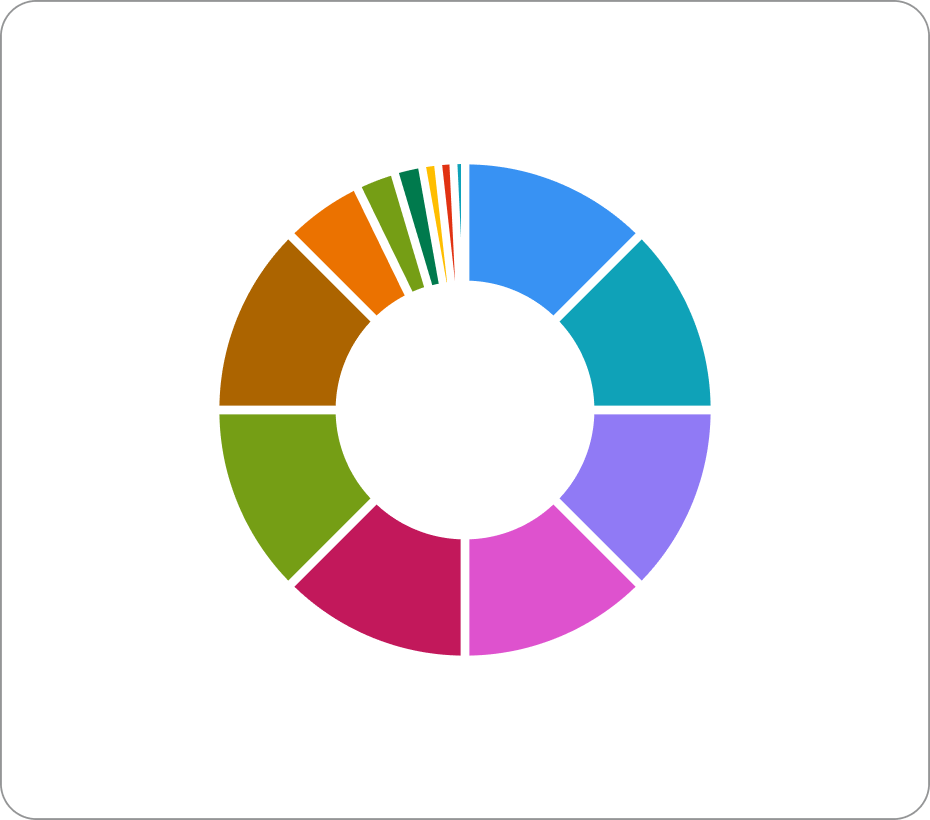
  <DoDont type="dont" text="use more than 9 variables. Try to rework it to use fewer.">
    <img src="https://mintcdn.com/servicetitan/mzb8vUC8QRJt2y_W/images/docs/web/data-visualization/categorical-color-palette/categorical-dont-9-plus.png?fit=max&auto=format&n=mzb8vUC8QRJt2y_W&q=85&s=f618d79ae2bced23a06a18e0c8412526" alt="donut chart with 9+ variables" className="m-block-0" width="930" height="820" data-path="images/docs/web/data-visualization/categorical-color-palette/categorical-dont-9-plus.png" />
  </DoDont>
</Columns>

### How to Use

<Columns cols={2}>
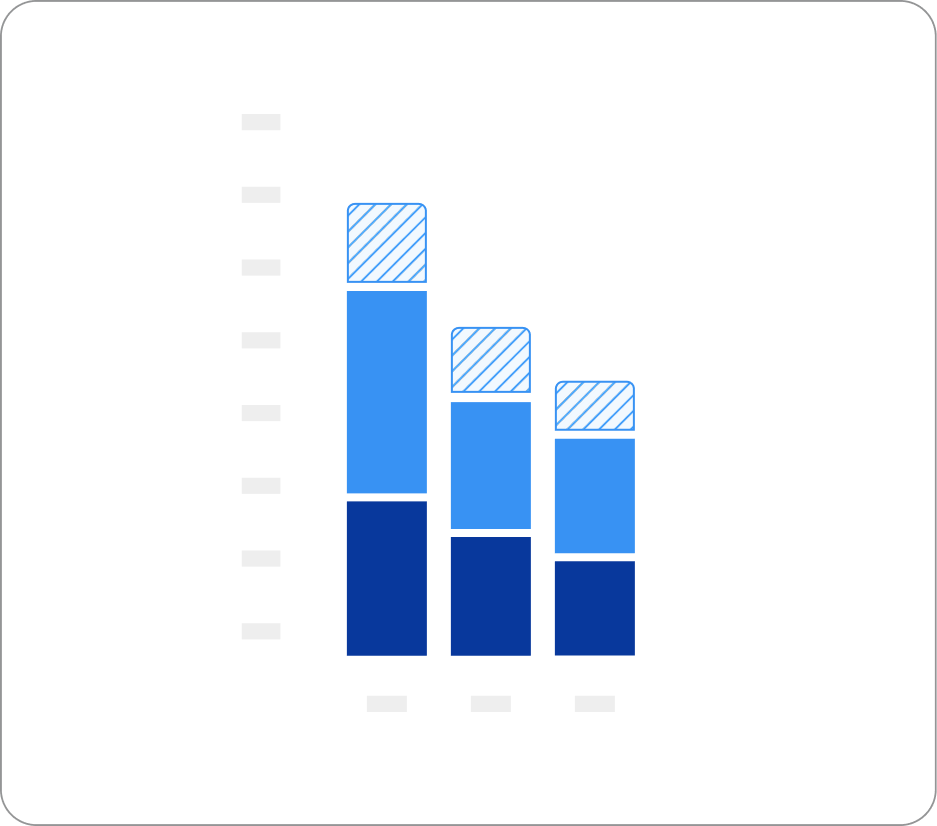
  <DoDont type="do" text="use a single, consistent color in stacked bar charts to represent the same category across intervals, apply a stroke to the lightest shade and pattern for accessibility, and use 4px spacing for visibility.">
    <img src="https://mintcdn.com/servicetitan/mzb8vUC8QRJt2y_W/images/docs/web/data-visualization/categorical-color-palette/categorical-do-consistent-stack.png?fit=max&auto=format&n=mzb8vUC8QRJt2y_W&q=85&s=8505169c3681c93c3adddfde0f9a57b9" alt="bar chart using 3 variables for each bar" className="m-block-0" width="937" height="826" data-path="images/docs/web/data-visualization/categorical-color-palette/categorical-do-consistent-stack.png" />
  </DoDont>

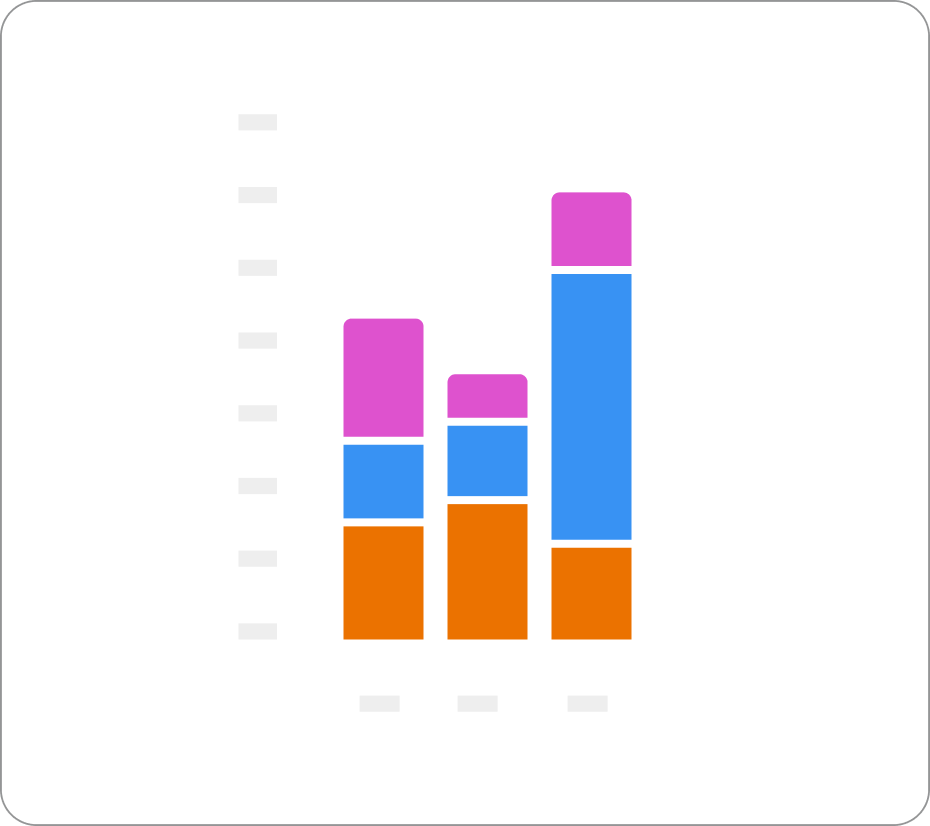
  <DoDont type="dont" text="do not use colors from our categorical palette on charts with less than 5 variables.">
    <img src="https://mintcdn.com/servicetitan/mzb8vUC8QRJt2y_W/images/docs/web/data-visualization/categorical-color-palette/categorical-dont-less-5.png?fit=max&auto=format&n=mzb8vUC8QRJt2y_W&q=85&s=290a075087b7e1118dce8a89b2646282" alt="bar chart with 3 variables using categorical palette" className="m-block-end-0 m-block-start-5" width="930" height="826" data-path="images/docs/web/data-visualization/categorical-color-palette/categorical-dont-less-5.png" />
  </DoDont>
</Columns>

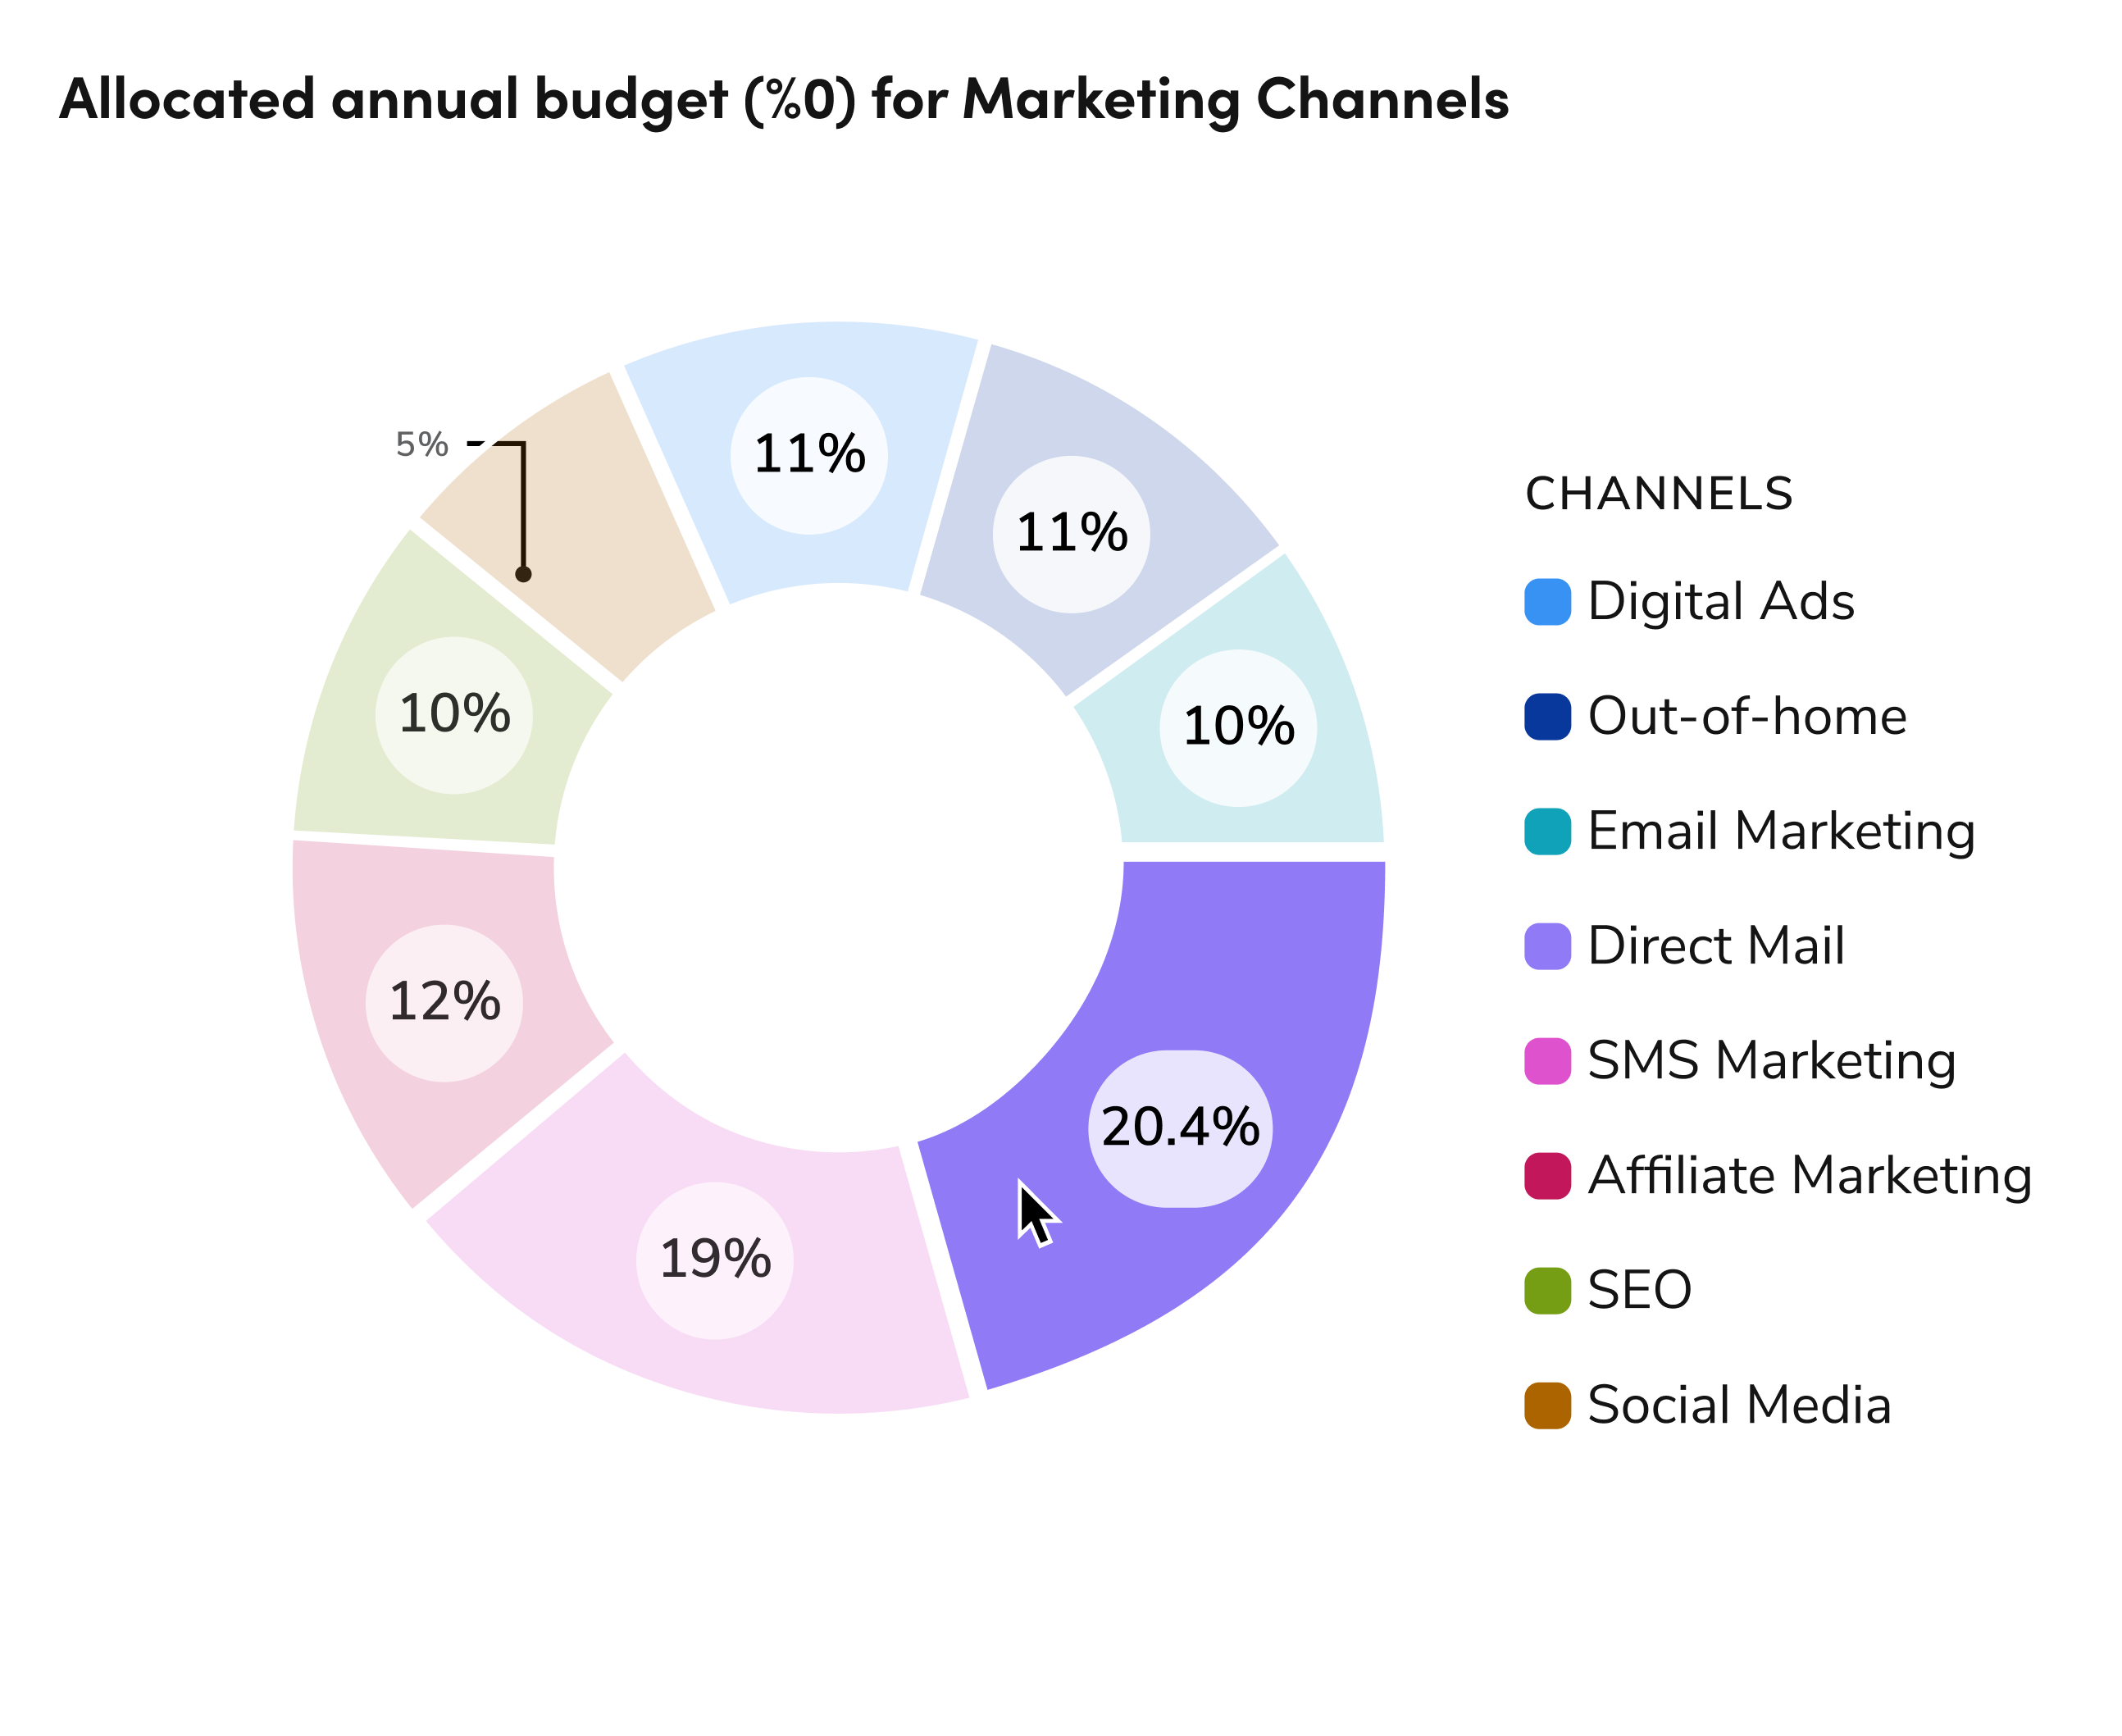
### Real Example showing a donut chart with 8 variables
<img src="https://mintcdn.com/servicetitan/UjzR2VvA6ZE_Niqw/images/docs/web/data-visualization/categorical-color-palette/categorical-allocated-annual-budget.png?fit=max&auto=format&n=UjzR2VvA6ZE_Niqw&q=85&s=f855ae70f69ffde07861438d83015629" alt="categorical dark mode" width="2588" height="2117" data-path="images/docs/web/data-visualization/categorical-color-palette/categorical-allocated-annual-budget.png" />

<Card title="Questions? Challenges?" icon="link" href="https://servicetitan.enterprise.slack.com/archives/C0881LFTGDR" arrow="true" cta="Click here">
  Contact the Visual Design team on the #ask-vizd channel
</Card>