> ## Documentation Index
> Fetch the complete documentation index at: https://anvil.servicetitan.com/llms.txt
> Use this file to discover all available pages before exploring further.

# Semantic Color Palette

> A semantic color palette is commonly applied to represent positive versus negative values, such as profit and loss, performance margins, or sentiment analysis.

export const DoDont = ({text, type, children}) => {
  return <>
      {type === "do" && <div className="do-dont do">
          {children && <div className="do-dont-content">{children}</div>}
          <Check>
            <p>
              <strong>Do</strong>
              {text && <span className="m-inline-start-1">{text}</span>}
            </p>
          </Check>
        </div>}
      {type === "dont" && <div className="do-dont dont">
          {children && <div className="do-dont-content">{children}</div>}
          <Danger>
            <p>
              <strong>Don't</strong>
              {text && <span className="m-inline-start-1">{text}</span>}
            </p>
          </Danger>
        </div>}
      {type === "caution" && <div className="do-dont caution">
          {children && <div className="do-dont-content">{children}</div>}
          <Warning>
            <p>
              <strong>Caution</strong>
              {text && <span className="m-inline-start-1">{text}</span>}
            </p>
          </Warning>
        </div>}
    </>;
};

## Use when:

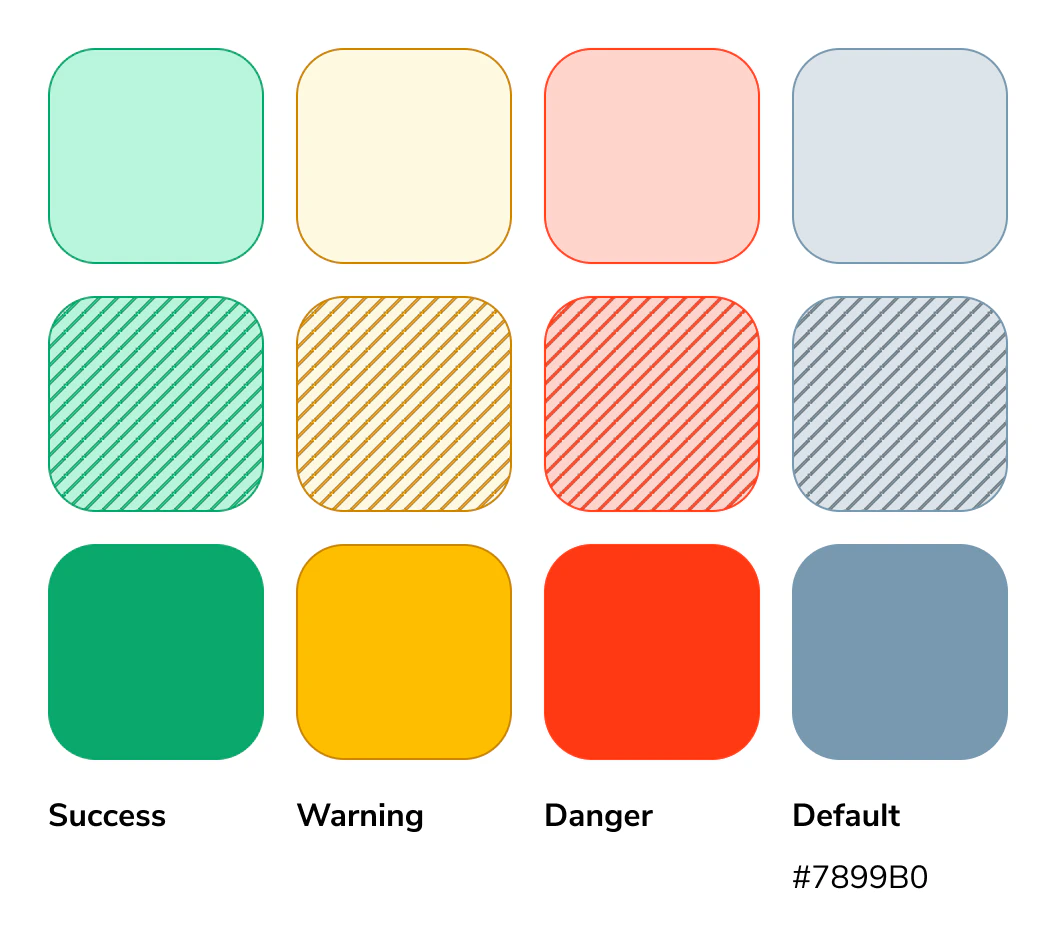
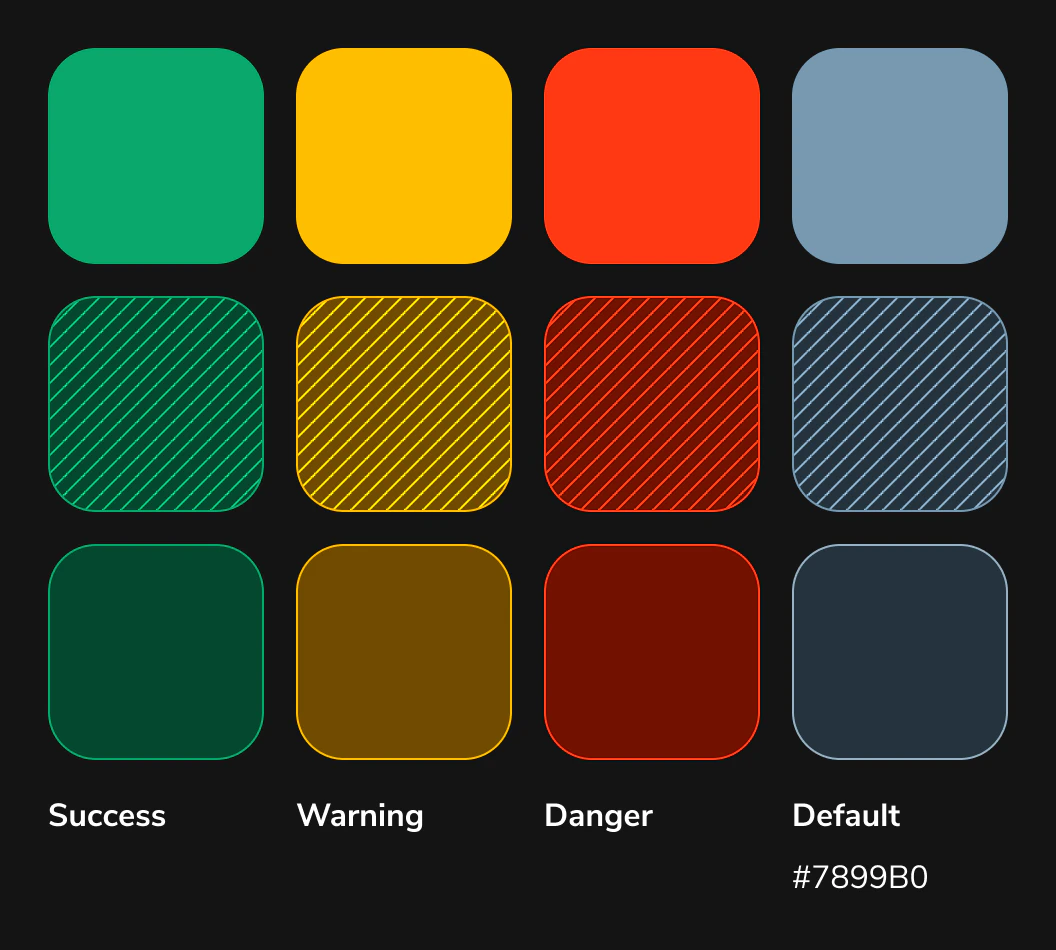
Semantic, or status, colors show the condition of data relative to a baseline.
Red indicates danger or error, yellow signals a warning, and green represents
normal or successful performance. These colors help users quickly understand
status at a glance.

### Light mode

<Columns cols={2}>
  <img
    src="https://mintcdn.com/servicetitan/7ob8rxQFEm423LLy/images/docs/web/data-visualization/semantic-color-palette/semantic-light-mode.png?fit=max&auto=format&n=7ob8rxQFEm423LLy&q=85&s=cb096439d573d07bd107fd61c3a73519"
    alt="semantic light
mode"
    width="1056"
    height="950"
    data-path="images/docs/web/data-visualization/semantic-color-palette/semantic-light-mode.png"
  />
</Columns>

### Dark mode

<Columns cols={2}>
  <img
    src="https://mintcdn.com/servicetitan/7ob8rxQFEm423LLy/images/docs/web/data-visualization/semantic-color-palette/semantic-dark-mode.png?fit=max&auto=format&n=7ob8rxQFEm423LLy&q=85&s=1a563785998ded3fc56ce957ad763609"
    alt="semantic dark
mode"
    width="1056"
    height="950"
    data-path="images/docs/web/data-visualization/semantic-color-palette/semantic-dark-mode.png"
  />
</Columns>

### Application Guidance

Green = success

Yellow = warning

Red = danger

Blue/grey = default

Start with tier 1 colors for all semantic needs, if your specific instance needs more nuance use the other tiers to illustrate importance by using saturation.
See example below:

### Real Example

See the invoice chart below. Both scenarios should signal a warning state. Use the tier 3 color for the variable with lower urgency. If an additional variable needs to be introduced, apply the patterned treatment as the intermediate option to indicate moderate urgency.

Use this pattern structure for success, warning, and default.

<img src="https://mintcdn.com/servicetitan/7ob8rxQFEm423LLy/images/docs/web/data-visualization/semantic-color-palette/semantic-real-example-light.png?fit=max&auto=format&n=7ob8rxQFEm423LLy&q=85&s=05ecbe7c68725ac2a3f52e18fe000a77" alt="real example, light mode" className="block dark:hidden" width="2024" height="343" data-path="images/docs/web/data-visualization/semantic-color-palette/semantic-real-example-light.png" />

<img src="https://mintcdn.com/servicetitan/7ob8rxQFEm423LLy/images/docs/web/data-visualization/semantic-color-palette/semantic-real-example-dark.png?fit=max&auto=format&n=7ob8rxQFEm423LLy&q=85&s=7d5a8849cd3c4c975c36dcb91aeccab4" alt="real example, dark mode" className="hidden dark:block" width="2024" height="326" data-path="images/docs/web/data-visualization/semantic-color-palette/semantic-real-example-dark.png" />

### How to Use

The following Do’s and Don’ts illustrate best practices and common mistakes to help guide effective use of the diverging color palette in data visualizations.

<Columns cols={2} className="mb-4">
  <DoDont type="do" text="use the diverging color palette to convey data status and direction, applying patterns for unclear states, yellow for warnings, green for success, and red for critical issues to support quick and consistent interpretation.">
    <img src="https://mintcdn.com/servicetitan/7ob8rxQFEm423LLy/images/docs/web/data-visualization/semantic-color-palette/semantic-do-diverging-light.png?fit=max&auto=format&n=7ob8rxQFEm423LLy&q=85&s=8c1c796c0606b5c7d73a5f76744d5ec8" alt="bar chart using 3 variables for each bar" className="block dark:hidden" width="937" height="484" data-path="images/docs/web/data-visualization/semantic-color-palette/semantic-do-diverging-light.png" />

    <img src="https://mintcdn.com/servicetitan/7ob8rxQFEm423LLy/images/docs/web/data-visualization/semantic-color-palette/semantic-do-diverging-dark.png?fit=max&auto=format&n=7ob8rxQFEm423LLy&q=85&s=2b42fbf8a6654d6be120580a3352cd59" alt="bar chart using 3 variables for each bar" className="hidden dark:block" width="937" height="484" data-path="images/docs/web/data-visualization/semantic-color-palette/semantic-do-diverging-dark.png" />
  </DoDont>

  <DoDont type="dont" text="use colors outside the defined diverging palette, as it introduces confusion, weakens meaning, and makes data interpretation less accurate.">
    <img src="https://mintcdn.com/servicetitan/7ob8rxQFEm423LLy/images/docs/web/data-visualization/semantic-color-palette/semantic-dont-outside-diverging-light.png?fit=max&auto=format&n=7ob8rxQFEm423LLy&q=85&s=b37b06060cf194df2f4089c5ed0a7e93" alt="bar chart with 3 variables using categorical palette" className="block dark:hidden" width="930" height="484" data-path="images/docs/web/data-visualization/semantic-color-palette/semantic-dont-outside-diverging-light.png" />

    <img src="https://mintcdn.com/servicetitan/7ob8rxQFEm423LLy/images/docs/web/data-visualization/semantic-color-palette/semantic-dont-outside-diverging-dark.png?fit=max&auto=format&n=7ob8rxQFEm423LLy&q=85&s=d8079a94531bb241e7b2934c1c181dcd" alt="bar chart with 3 variables using categorical palette" className="hidden dark:block" width="930" height="484" data-path="images/docs/web/data-visualization/semantic-color-palette/semantic-dont-outside-diverging-dark.png" />
  </DoDont>
</Columns>

<Columns cols={2}>
  <DoDont type="do" text="choose colors intentionally to convey the right message, using green for success, red for danger, yellow for warning, and patterned fills for neutral or pending states, ensuring alignment with data status to avoid misinterpretation and enhance clarity.">
    <img src="https://mintcdn.com/servicetitan/7ob8rxQFEm423LLy/images/docs/web/data-visualization/semantic-color-palette/semantic-do-convey-message-light.png?fit=max&auto=format&n=7ob8rxQFEm423LLy&q=85&s=8bd11c0d7aad626dc8219b41348e7550" alt="bar chart with 3 variables using categorical palette" className="block dark:hidden" width="937" height="826" data-path="images/docs/web/data-visualization/semantic-color-palette/semantic-do-convey-message-light.png" />

    <img src="https://mintcdn.com/servicetitan/7ob8rxQFEm423LLy/images/docs/web/data-visualization/semantic-color-palette/semantic-do-convey-message-dark.png?fit=max&auto=format&n=7ob8rxQFEm423LLy&q=85&s=a439761476438c6fcc3e950cda8976a0" alt="bar chart with 3 variables using categorical palette" className="hidden dark:block" width="937" height="826" data-path="images/docs/web/data-visualization/semantic-color-palette/semantic-do-convey-message-dark.png" />
  </DoDont>

  <DoDont type="dont" text="use the diverging color palette for data that doesn't represent a clear positive, negative, or neutral status, as it can create confusion and lead to incorrect interpretations.">
    <img src="https://mintcdn.com/servicetitan/7ob8rxQFEm423LLy/images/docs/web/data-visualization/semantic-color-palette/semantic-dont-non-semantic-light.png?fit=max&auto=format&n=7ob8rxQFEm423LLy&q=85&s=ead1eaab7322c65701c3e7a0044f40bd" alt="bar chart with 3 variables using categorical palette" className="block dark:hidden" width="930" height="826" data-path="images/docs/web/data-visualization/semantic-color-palette/semantic-dont-non-semantic-light.png" />

    <img src="https://mintcdn.com/servicetitan/7ob8rxQFEm423LLy/images/docs/web/data-visualization/semantic-color-palette/semantic-dont-non-semantic-dark.png?fit=max&auto=format&n=7ob8rxQFEm423LLy&q=85&s=272e6bbeb43dae3e1b805f311b617865" alt="bar chart with 3 variables using categorical palette" className="hidden dark:block" width="930" height="826" data-path="images/docs/web/data-visualization/semantic-color-palette/semantic-dont-non-semantic-dark.png" />
  </DoDont>
</Columns>

<Card title="Questions? Challenges?" icon="link" href="https://servicetitan.enterprise.slack.com/archives/C0881LFTGDR" arrow="true" cta="Click here">
  Contact the Visual Design team on the #ask-vizd channel
</Card>