> ## Documentation Index
> Fetch the complete documentation index at: https://anvil.servicetitan.com/llms.txt
> Use this file to discover all available pages before exploring further.

# Line Charts

> A line chart is a simple and effective type of graph used to visualize how values change over time. It displays data points (called markers) on a two-dimensional XY grid and connects them with straight lines to illustrate progression. Time is shown on the horizontal (X) axis, while the measured value (also known as the variable of interest) appears on the vertical (Y) axis. Line charts are ideal for tracking trends or changes over a continuous time period, comparing multiple datasets across the same timeline, and presenting clear, easy-to-read patterns within the data.

export const DoDont = ({text, type, children}) => {
  return <>
      {type === "do" && <div className="do-dont do">
          {children && <div className="do-dont-content">{children}</div>}
          <Check>
            <p>
              <strong>Do</strong>
              {text && <span className="m-inline-start-1">{text}</span>}
            </p>
          </Check>
        </div>}
      {type === "dont" && <div className="do-dont dont">
          {children && <div className="do-dont-content">{children}</div>}
          <Danger>
            <p>
              <strong>Don't</strong>
              {text && <span className="m-inline-start-1">{text}</span>}
            </p>
          </Danger>
        </div>}
      {type === "caution" && <div className="do-dont caution">
          {children && <div className="do-dont-content">{children}</div>}
          <Warning>
            <p>
              <strong>Caution</strong>
              {text && <span className="m-inline-start-1">{text}</span>}
            </p>
          </Warning>
        </div>}
    </>;
};

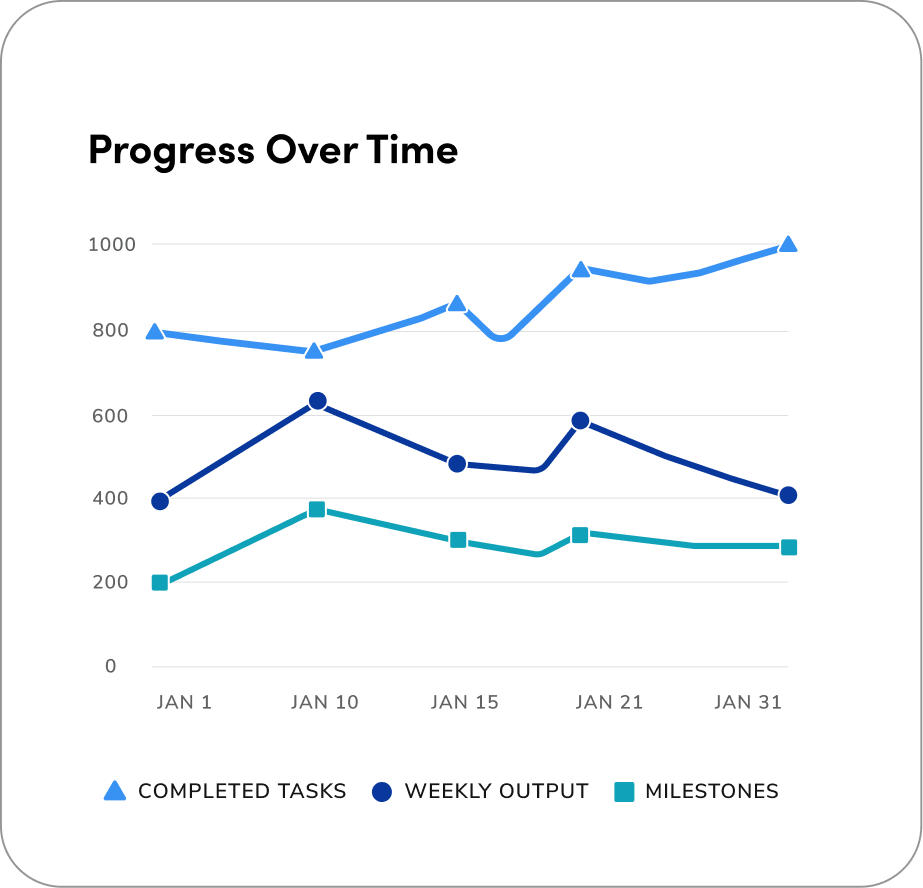
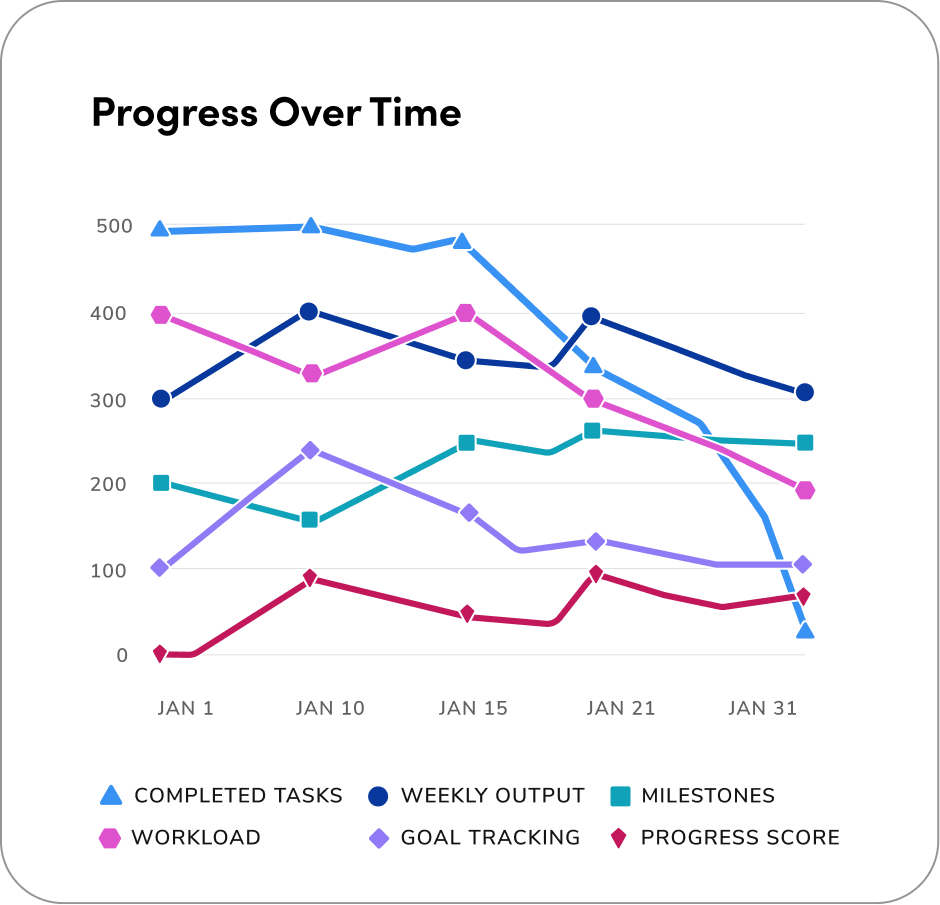
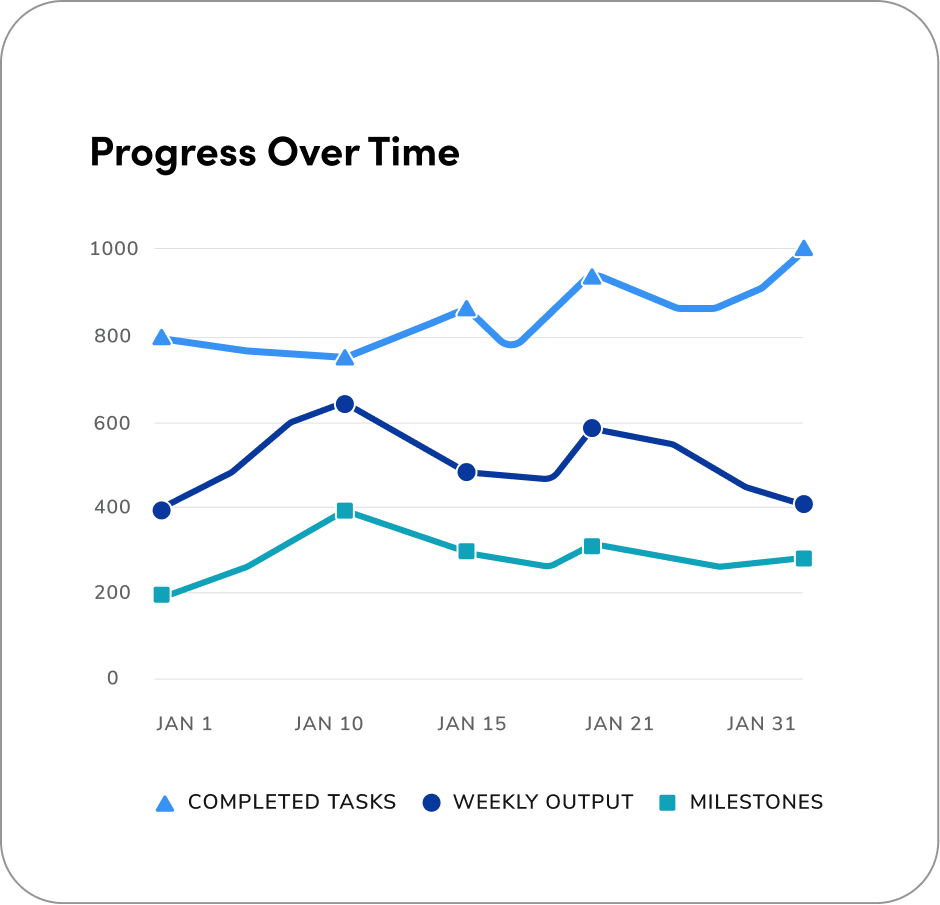
For line charts, we recommend an ideal state of 3 data sets for optimal readability and immediate understanding. Our color palette offers additional options, allowing users to add more lines as needed. However, we advise limiting the total to no more than 6 data sets to prevent visual clutter and maintain clarity. This approach balances a clean default view with flexibility for more complex analysis.

<Note>Note: Use only when data points are continuous; the chart assumes a logical progression and meaningful connection between all points.</Note>

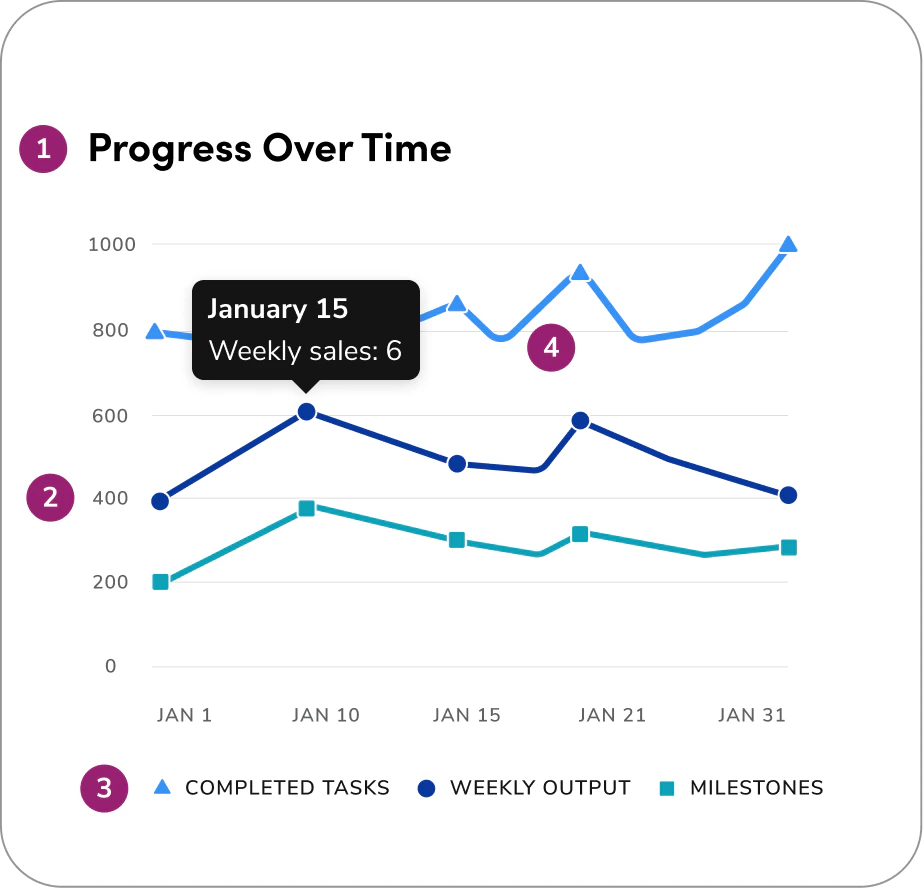
Example of a line chart using and hover state:

<Columns cols={2}>
  <img src="https://mintcdn.com/servicetitan/7ob8rxQFEm423LLy/images/docs/web/data-visualization/line-charts/line-charts-redlines.png?fit=max&auto=format&n=7ob8rxQFEm423LLy&q=85&s=fd1be2457f18f12f27ff3498ca13bec5" alt="A line chart with redlines" width="923" height="888" data-path="images/docs/web/data-visualization/line-charts/line-charts-redlines.png" />

  <ol>
    <li><strong>Headline</strong></li>
    <li><strong>Axis label</strong></li>
    <li><strong>Legend label</strong></li>
    <li><strong>Direct labeling</strong></li>
    <li><strong><a href="/docs/web/data-visualization/accessibility#hover-states">Hover state tooltip</a></strong></li>
  </ol>
</Columns>

## Variable ordering

| **1 Variable**                                                                                                                                                                                                                                                                                                                                                                                                                                                                                                                                                                                                                                                                                                                                                                                                                                                                                                                                                                                                                                                                                                                                                                                                                                                                                                                                                                                                                                                                                                                                                                                                                                                                                                                                                                                                 | **2 Variables**                                                                                                                                                                                                                                                                                                                                                                                                                                                                                                                                                                                                                                                                                                                                                                                                                                                                                                                                                                                                                                                                                                                                                                                                                                                                                                                                                                                                                                                                                                                                                                                                                                                                                                                                                                                                         | **3 Variables**                                                                                                                                                                                                                                                                                                                                                                                                                                                                                                                                                                                                                                                                                                                                                                                                                                                                                                                                                                                                                                                                                                                                                                                                                                                                                                                                                                                                                                                                                                                                                                                                                                                                                                                                                                                                        | **4+ Variables**                                                                                                                                                                                                                                                                                                                                                                                                                                                                                                                                                                                                                                                                                                                                                                                                                                                                                                                                                                                                                                                                                                                                                                                                                                                                                                                                                                                                                                                                                                                                                                                                                                                                                                                                                                                                                                                 |
| -------------------------------------------------------------------------------------------------------------------------------------------------------------------------------------------------------------------------------------------------------------------------------------------------------------------------------------------------------------------------------------------------------------------------------------------------------------------------------------------------------------------------------------------------------------------------------------------------------------------------------------------------------------------------------------------------------------------------------------------------------------------------------------------------------------------------------------------------------------------------------------------------------------------------------------------------------------------------------------------------------------------------------------------------------------------------------------------------------------------------------------------------------------------------------------------------------------------------------------------------------------------------------------------------------------------------------------------------------------------------------------------------------------------------------------------------------------------------------------------------------------------------------------------------------------------------------------------------------------------------------------------------------------------------------------------------------------------------------------------------------------------------------------------------------------- | ----------------------------------------------------------------------------------------------------------------------------------------------------------------------------------------------------------------------------------------------------------------------------------------------------------------------------------------------------------------------------------------------------------------------------------------------------------------------------------------------------------------------------------------------------------------------------------------------------------------------------------------------------------------------------------------------------------------------------------------------------------------------------------------------------------------------------------------------------------------------------------------------------------------------------------------------------------------------------------------------------------------------------------------------------------------------------------------------------------------------------------------------------------------------------------------------------------------------------------------------------------------------------------------------------------------------------------------------------------------------------------------------------------------------------------------------------------------------------------------------------------------------------------------------------------------------------------------------------------------------------------------------------------------------------------------------------------------------------------------------------------------------------------------------------------------------- | ---------------------------------------------------------------------------------------------------------------------------------------------------------------------------------------------------------------------------------------------------------------------------------------------------------------------------------------------------------------------------------------------------------------------------------------------------------------------------------------------------------------------------------------------------------------------------------------------------------------------------------------------------------------------------------------------------------------------------------------------------------------------------------------------------------------------------------------------------------------------------------------------------------------------------------------------------------------------------------------------------------------------------------------------------------------------------------------------------------------------------------------------------------------------------------------------------------------------------------------------------------------------------------------------------------------------------------------------------------------------------------------------------------------------------------------------------------------------------------------------------------------------------------------------------------------------------------------------------------------------------------------------------------------------------------------------------------------------------------------------------------------------------------------------------------------------- | ---------------------------------------------------------------------------------------------------------------------------------------------------------------------------------------------------------------------------------------------------------------------------------------------------------------------------------------------------------------------------------------------------------------------------------------------------------------------------------------------------------------------------------------------------------------------------------------------------------------------------------------------------------------------------------------------------------------------------------------------------------------------------------------------------------------------------------------------------------------------------------------------------------------------------------------------------------------------------------------------------------------------------------------------------------------------------------------------------------------------------------------------------------------------------------------------------------------------------------------------------------------------------------------------------------------------------------------------------------------------------------------------------------------------------------------------------------------------------------------------------------------------------------------------------------------------------------------------------------------------------------------------------------------------------------------------------------------------------------------------------------------------------------------------------------------------------------------------------------------- |
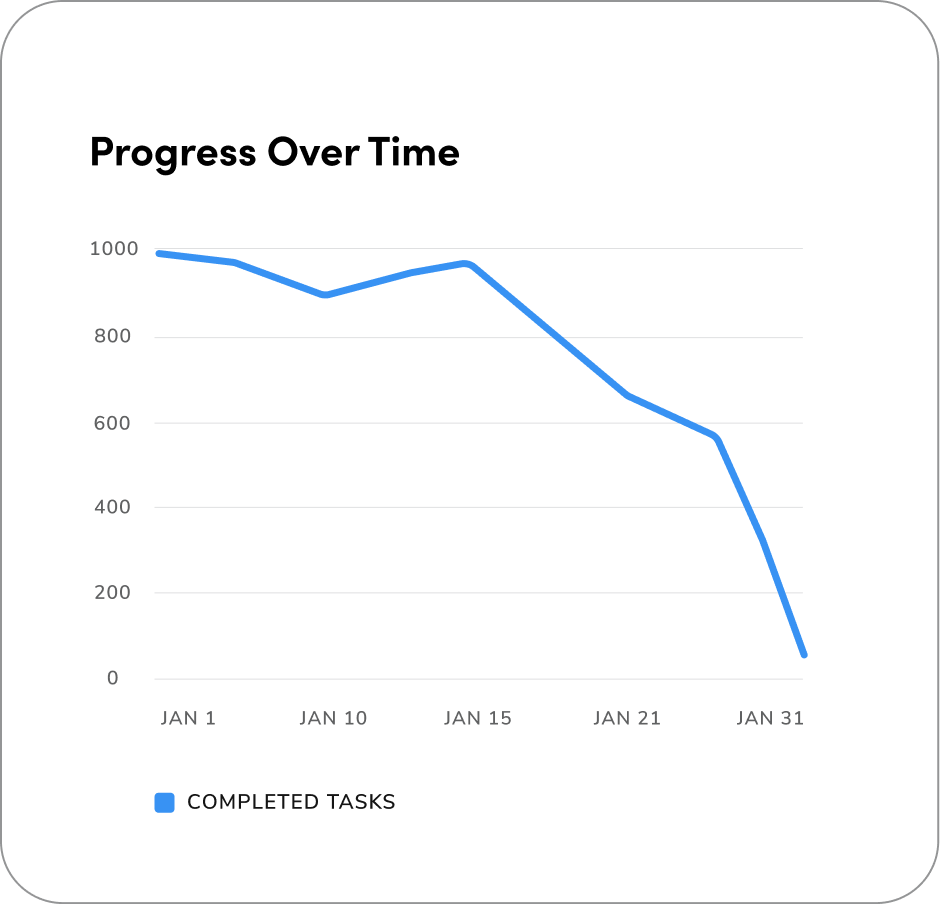
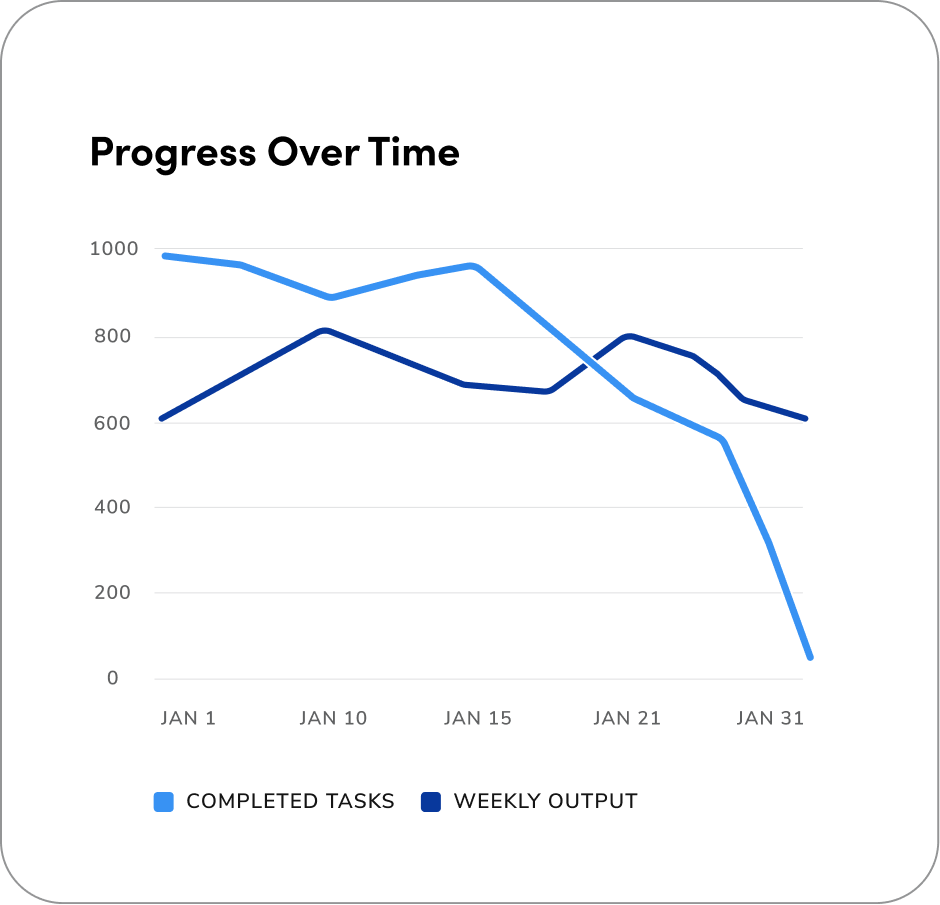
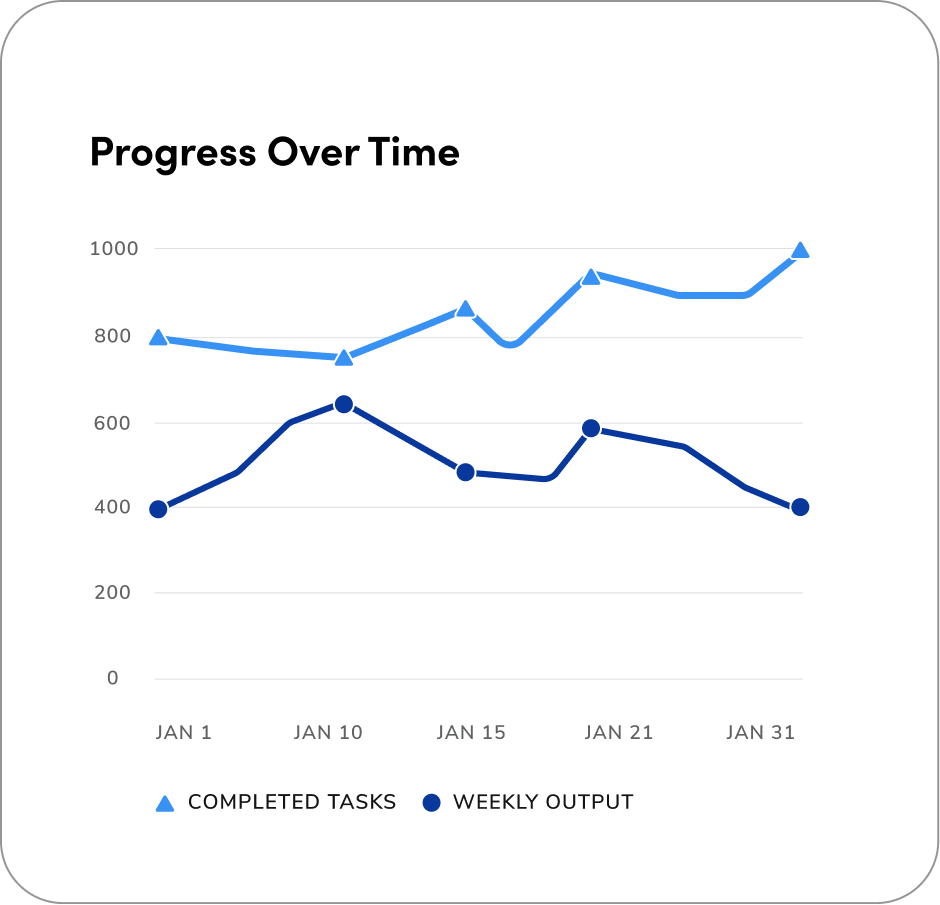
| If your chart has **one** variable, start with the default blue hue in the palette.                                                                                                                                                                                                                                                                                                                                                                                                                                                                                                                                                                                                                                                                                                                                                                                                                                                                                                                                                                                                                                                                                                                                                                                                                                                                                                                                                                                                                                                                                                                                                                                                                                                                                                                            | If your chart has **two** variables, use the default and dark blue.                                                                                                                                                                                                                                                                                                                                                                                                                                                                                                                                                                                                                                                                                                                                                                                                                                                                                                                                                                                                                                                                                                                                                                                                                                                                                                                                                                                                                                                                                                                                                                                                                                                                                                                                                     | If your chart has **three** variables, add the cyan.                                                                                                                                                                                                                                                                                                                                                                                                                                                                                                                                                                                                                                                                                                                                                                                                                                                                                                                                                                                                                                                                                                                                                                                                                                                                                                                                                                                                                                                                                                                                                                                                                                                                                                                                                                   | For 4+ variables, continue with the categorical color palette.                                                                                                                                                                                                                                                                                                                                                                                                                                                                                                                                                                                                                                                                                                                                                                                                                                                                                                                                                                                                                                                                                                                                                                                                                                                                                                                                                                                                                                                                                                                                                                                                                                                                                                                                                                                                   |
| <img src="https://mintcdn.com/servicetitan/JOXKXxZG3fxsW6pa/images/docs/web/data-visualization/line-charts/line-charts-1-variable.png?fit=max&auto=format&n=JOXKXxZG3fxsW6pa&q=85&s=9e4a3e3b9305dd8a580e00caaca20270" alt="variable ordering, 1 variable" width="404" height="166" data-path="images/docs/web/data-visualization/line-charts/line-charts-1-variable.png" /> | <img src="https://mintcdn.com/servicetitan/JOXKXxZG3fxsW6pa/images/docs/web/data-visualization/line-charts/line-charts-2-variables.png?fit=max&auto=format&n=JOXKXxZG3fxsW6pa&q=85&s=d6daf259a8f7be51729ddae8cb3e444f" alt="variable ordering, 2 variables" width="404" height="166" data-path="images/docs/web/data-visualization/line-charts/line-charts-2-variables.png" /> | <img src="https://mintcdn.com/servicetitan/JOXKXxZG3fxsW6pa/images/docs/web/data-visualization/line-charts/line-charts-3-variables.png?fit=max&auto=format&n=JOXKXxZG3fxsW6pa&q=85&s=e11c116c266399acea7cf6360e521186" alt="variable ordering, 1 variable" width="404" height="166" data-path="images/docs/web/data-visualization/line-charts/line-charts-3-variables.png" /> | <img src="https://mintcdn.com/servicetitan/JOXKXxZG3fxsW6pa/images/docs/web/data-visualization/line-charts/line-charts-4-plus-variables.png?fit=max&auto=format&n=JOXKXxZG3fxsW6pa&q=85&s=3471e7ca3b2bda45cc93f7852bc3766c" alt="variable ordering, 4+ variables" width="404" height="166" data-path="images/docs/web/data-visualization/line-charts/line-charts-4-plus-variables.png" /> |

<Columns cols={2} className="mb-4">
  <div className="flex flex-col items-center gap-2">
    <Badge color="green">One Variable</Badge>

    <img src="https://mintcdn.com/servicetitan/H6IrrYy_BHqQ84Cc/images/docs/web/data-visualization/line-charts/line-charts-one-variable-example.png?fit=max&auto=format&n=H6IrrYy_BHqQ84Cc&q=85&s=5c854fa9cd796a0c5972c0ef3952448f" alt="1 variable line chart example" width="940" height="905" data-path="images/docs/web/data-visualization/line-charts/line-charts-one-variable-example.png" />
  </div>

  <div className="flex flex-col items-center gap-2">
    <Badge color="green">Two Variables</Badge>

    <img src="https://mintcdn.com/servicetitan/H6IrrYy_BHqQ84Cc/images/docs/web/data-visualization/line-charts/line-charts-two-variables-example.png?fit=max&auto=format&n=H6IrrYy_BHqQ84Cc&q=85&s=e2579268aca9c53230bf375479b59eea" alt="2 variables line chart example" width="940" height="905" data-path="images/docs/web/data-visualization/line-charts/line-charts-two-variables-example.png" />
  </div>
</Columns>

<Columns cols={2}>
  <div className="flex flex-col items-center gap-2">
    <Badge color="green">Three Variables</Badge>

    <img src="https://mintcdn.com/servicetitan/H6IrrYy_BHqQ84Cc/images/docs/web/data-visualization/line-charts/line-charts-three-variables-example.png?fit=max&auto=format&n=H6IrrYy_BHqQ84Cc&q=85&s=42c2ff3f873126e94e3ccb4144ed2d44" alt="3 variables line chart example" width="923" height="888" data-path="images/docs/web/data-visualization/line-charts/line-charts-three-variables-example.png" />
  </div>

  <div className="flex flex-col items-center gap-2">
    <Badge color="green">Four Variables</Badge>

    <img src="https://mintcdn.com/servicetitan/H6IrrYy_BHqQ84Cc/images/docs/web/data-visualization/line-charts/line-charts-four-plus-variables-example.png?fit=max&auto=format&n=H6IrrYy_BHqQ84Cc&q=85&s=95284aaee462a9b13bdf099758c57d09" alt="4+ variables line chart example" width="940" height="905" data-path="images/docs/web/data-visualization/line-charts/line-charts-four-plus-variables-example.png" />
  </div>
</Columns>

## Shapes

Shapes in line charts help tell data series apart. When using 3 or more variables, adding distinct shapes improves accessibility for color-blind or visually impaired users. Make sure the legend uses shapes only to clearly show each series. Follow the shape order as it is displayed below.

<Note>Note: Working with an edge case and need more shape options? Feel free to reach out in the <a href="https://servicetitan.enterprise.slack.com/archives/C0881LFTGDR" target="_blank">#askvizd channel</a>, we're happy to help!</Note>

<div className="flex flex-col gap-2">
  <div className="flex gap-2 items-center max-w-4 h-4">
    <img src="https://mintcdn.com/servicetitan/H6IrrYy_BHqQ84Cc/images/docs/web/data-visualization/line-charts/triangle.png?fit=max&auto=format&n=H6IrrYy_BHqQ84Cc&q=85&s=b8c3dfda59ba4a6127f344dbcfe1763c" alt="" width="45" height="40" data-path="images/docs/web/data-visualization/line-charts/triangle.png" />

    <span>Triangle</span>
  </div>

  <div className="flex gap-2 items-center max-w-4 h-4">
    <img src="https://mintcdn.com/servicetitan/H6IrrYy_BHqQ84Cc/images/docs/web/data-visualization/line-charts/square.png?fit=max&auto=format&n=H6IrrYy_BHqQ84Cc&q=85&s=f69903e5e11d4af87072e0c94b4093a2" alt="" width="40" height="40" data-path="images/docs/web/data-visualization/line-charts/square.png" />

    <span>Square</span>
  </div>

  <div className="flex gap-2 items-center max-w-4 h-4">
    <img src="https://mintcdn.com/servicetitan/JOXKXxZG3fxsW6pa/images/docs/web/data-visualization/line-charts/circle.png?fit=max&auto=format&n=JOXKXxZG3fxsW6pa&q=85&s=3121557fa16861e85f1c1abe28010266" alt="" width="40" height="40" data-path="images/docs/web/data-visualization/line-charts/circle.png" />

    <span>Circle</span>
  </div>
</div>

Additional shapes for edge case scenarios:

<div className="flex flex-col gap-2">
  <div className="flex gap-2 items-center max-w-4 h-4">
    <img src="https://mintcdn.com/servicetitan/JOXKXxZG3fxsW6pa/images/docs/web/data-visualization/line-charts/diamond.png?fit=max&auto=format&n=JOXKXxZG3fxsW6pa&q=85&s=cd7490c029705a882f36ba99815f13a5" alt="" width="36" height="40" data-path="images/docs/web/data-visualization/line-charts/diamond.png" />

    <span>Rhombus</span>
  </div>

  <div className="flex gap-2 items-center max-w-4 h-4">
    <img src="https://mintcdn.com/servicetitan/JOXKXxZG3fxsW6pa/images/docs/web/data-visualization/line-charts/hexagon.png?fit=max&auto=format&n=JOXKXxZG3fxsW6pa&q=85&s=07baa03d79ab885aa5f59d429bde7191" alt="" width="38" height="33" data-path="images/docs/web/data-visualization/line-charts/hexagon.png" />

    <span>Hexagon</span>
  </div>

  <div className="flex gap-2 items-center max-w-4 h-4">
    <img src="https://mintcdn.com/servicetitan/JOXKXxZG3fxsW6pa/images/docs/web/data-visualization/line-charts/kite.png?fit=max&auto=format&n=JOXKXxZG3fxsW6pa&q=85&s=c5f06be43745bfa46cf9f78daaedc6be" alt="" width="40" height="40" data-path="images/docs/web/data-visualization/line-charts/kite.png" />

    <span>Kite</span>
  </div>
</div>

## Real Example #1

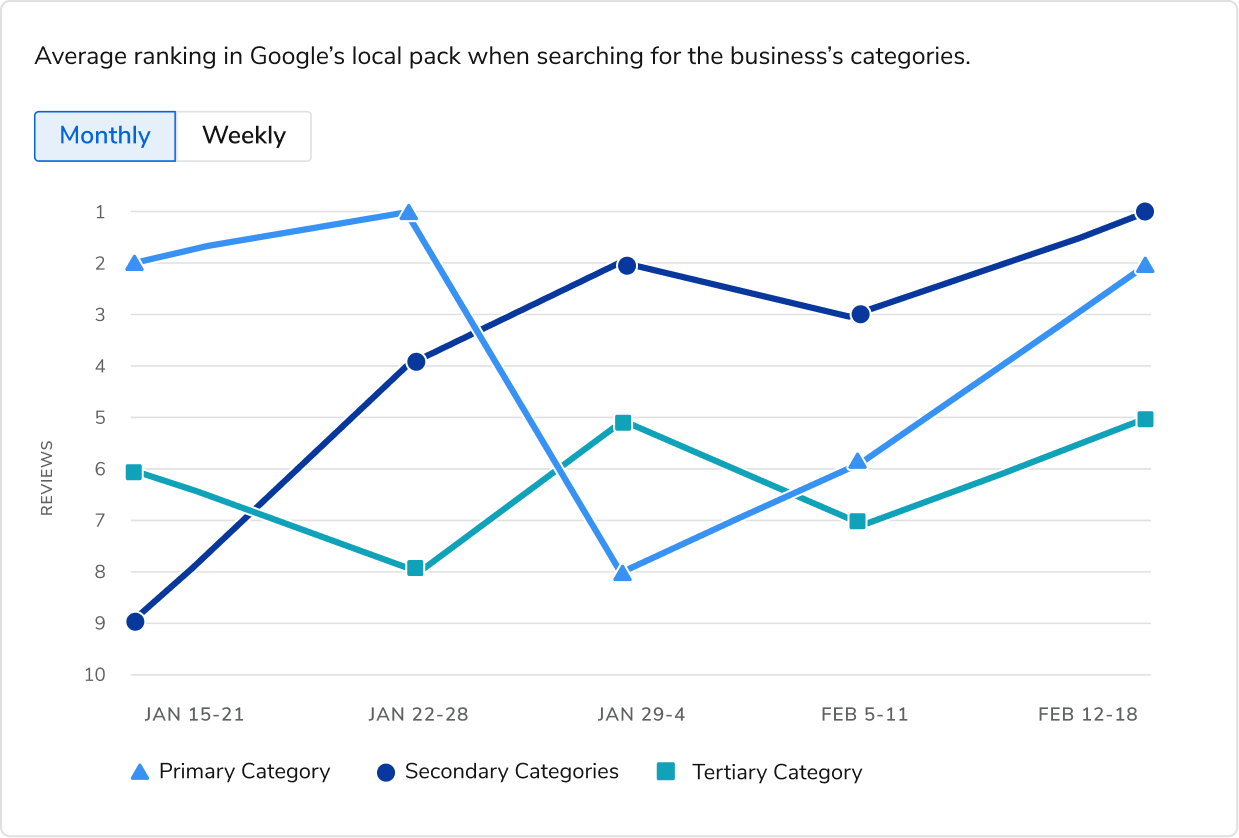
The following is a real-world example from our product. This example displays 3 variables in a single line chart. It uses the first three colors of the categorical color palette and shapes to show the difference between each line.
<Columns cols={2}>
  <img src="https://mintcdn.com/servicetitan/H6IrrYy_BHqQ84Cc/images/docs/web/data-visualization/line-charts/line-charts-real-example.png?fit=max&auto=format&n=H6IrrYy_BHqQ84Cc&q=85&s=c5b4f5b84bd5f49c80d4c2c4808b9108" alt="Average ranking in Google's local pack when searching for the business's categories (chart)" width="1239" height="838" data-path="images/docs/web/data-visualization/line-charts/line-charts-real-example.png" />
</Columns>

### How to Use

The following Do's and Don'ts illustrate best practices and common mistakes to help guide effective use of line charts in data visualizations.
<Columns cols={2} className="mb-4">
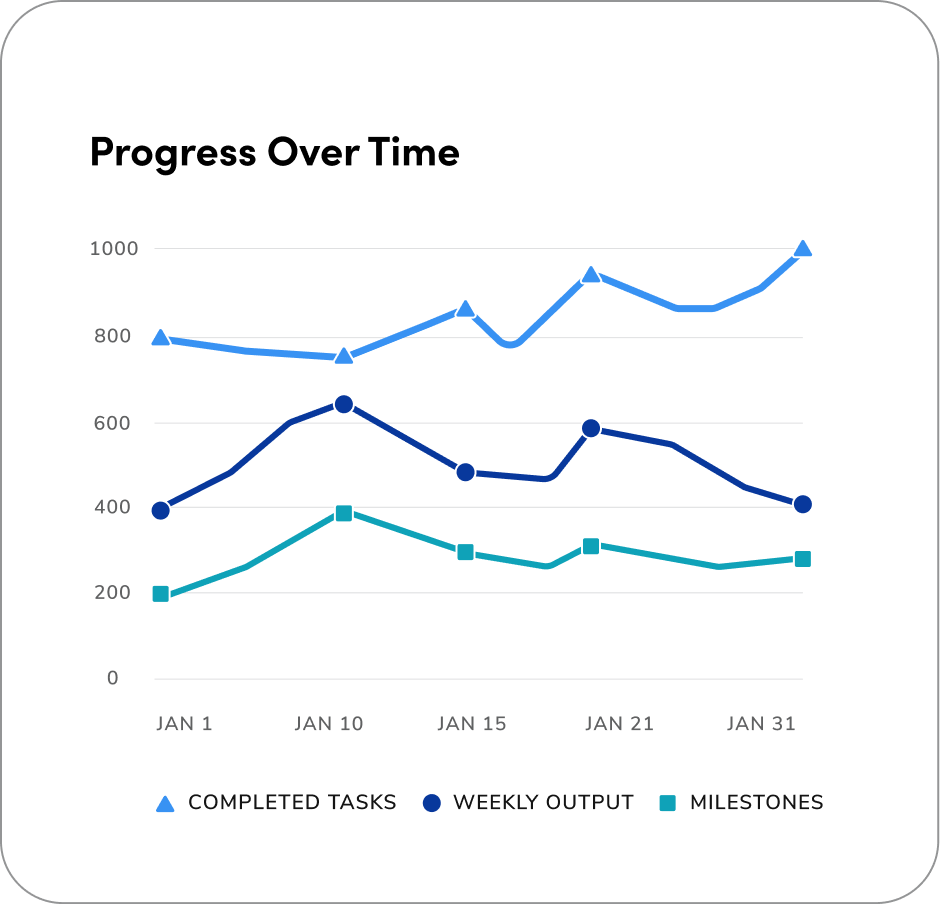
  <DoDont type="do" text="make sure the shapes in your line charts are a consistent, readable size—neither too small nor too large. Match the shape size to the example above. The final size may vary depending on factors like chart dimensions and screen resolution.">
    <img src="https://mintcdn.com/servicetitan/JOXKXxZG3fxsW6pa/images/docs/web/data-visualization/line-charts/line-charts-do-consistent.png?fit=max&auto=format&n=JOXKXxZG3fxsW6pa&q=85&s=eb442746011b2afcfbd9694029665d48" alt="line chart with consistent shape sizing" width="940" height="905" data-path="images/docs/web/data-visualization/line-charts/line-charts-do-consistent.png" />
  </DoDont>

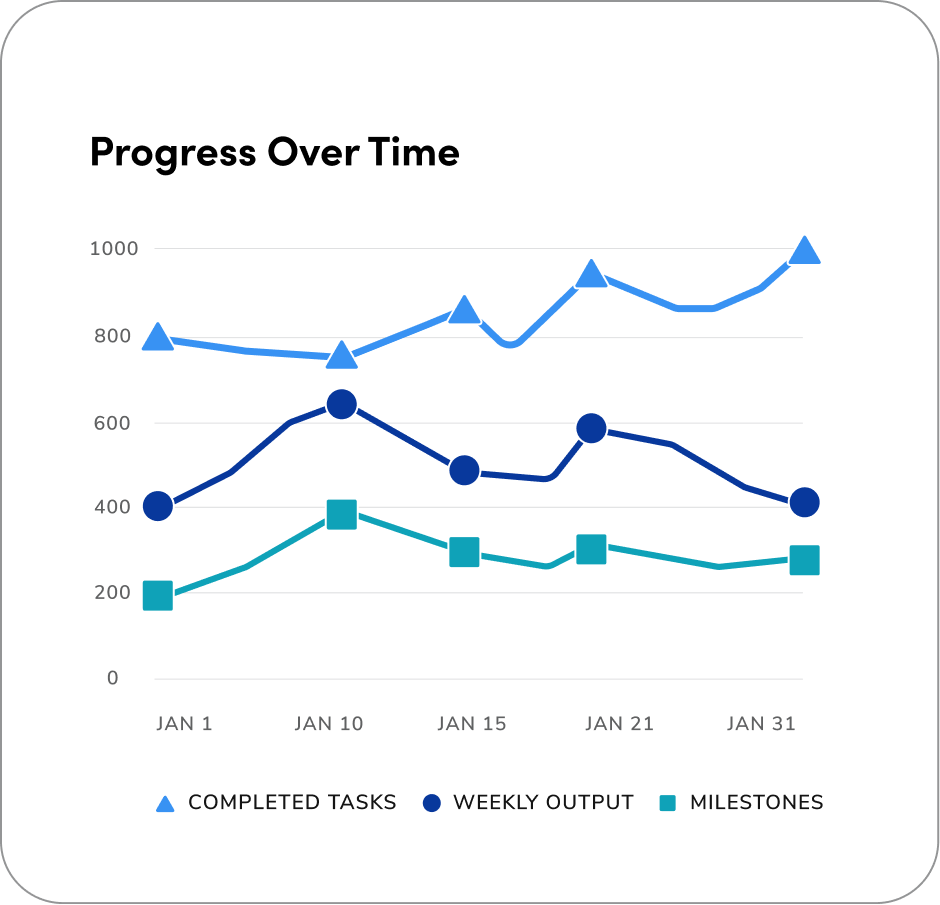
  <DoDont type="dont" text="use large chart shapes - it will make the layout look visually unbalanced.">
    <img src="https://mintcdn.com/servicetitan/JOXKXxZG3fxsW6pa/images/docs/web/data-visualization/line-charts/line-charts-dont-consistent.png?fit=max&auto=format&n=JOXKXxZG3fxsW6pa&q=85&s=d01e85ca0fe6e42d90ba09150249df19" alt="line chart with inconsistent shape sizing" width="940" height="905" data-path="images/docs/web/data-visualization/line-charts/line-charts-dont-consistent.png" />
  </DoDont>
</Columns>

<Columns cols={2} className="mb-4">
  <DoDont type="do" text="use shapes for line charts with 3+ variables">
    <img src="https://mintcdn.com/servicetitan/JOXKXxZG3fxsW6pa/images/docs/web/data-visualization/line-charts/line-charts-dont-shapes.png?fit=max&auto=format&n=JOXKXxZG3fxsW6pa&q=85&s=fac25b1dd960655f1922a16419191762" alt="line chart with shapes for data points at 3+ variables" width="940" height="905" data-path="images/docs/web/data-visualization/line-charts/line-charts-dont-shapes.png" />
  </DoDont>

  <DoDont type="dont" text="use shapes on line charts with less than 2 variables.">
    <img src="https://mintcdn.com/servicetitan/JOXKXxZG3fxsW6pa/images/docs/web/data-visualization/line-charts/line-charts-dont-shapes.png?fit=max&auto=format&n=JOXKXxZG3fxsW6pa&q=85&s=fac25b1dd960655f1922a16419191762" alt="line chart with shapes for data points with less than 3 variables" width="940" height="905" data-path="images/docs/web/data-visualization/line-charts/line-charts-dont-shapes.png" />
  </DoDont>
</Columns>

<Columns cols={2} className="mb-4">
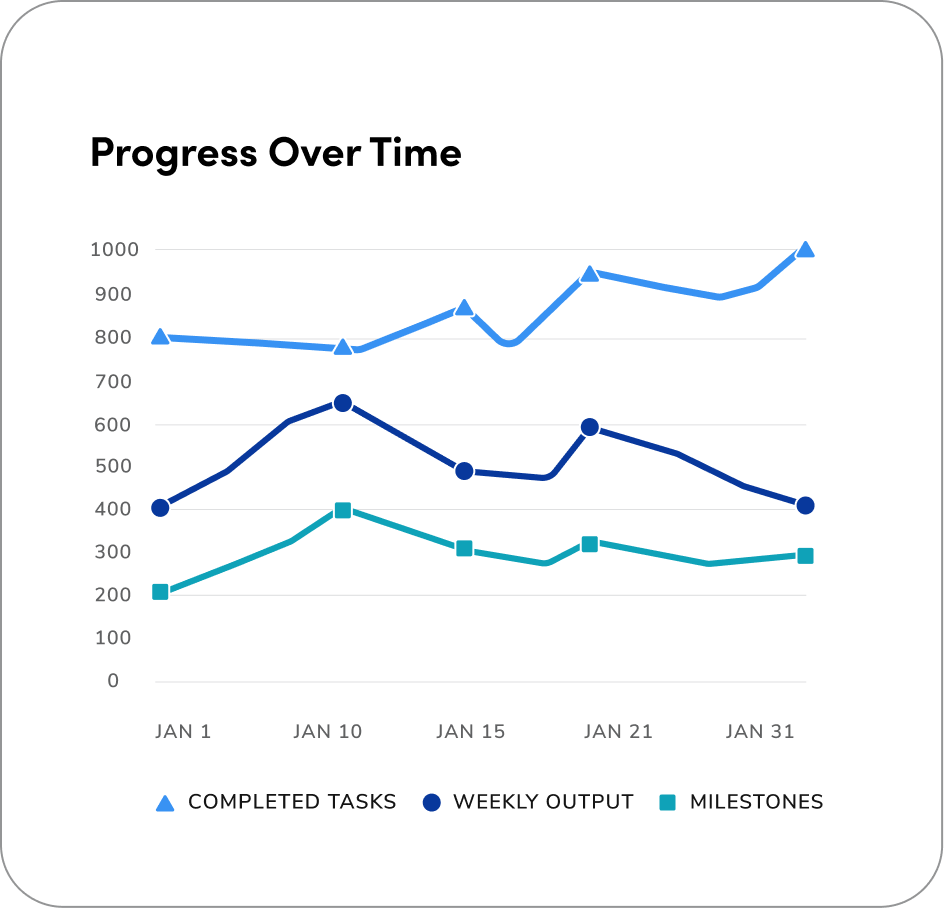
  <DoDont type="do" text="ensure readability by using a clear and balanced number of axis labels.">
    <img src="https://mintcdn.com/servicetitan/JOXKXxZG3fxsW6pa/images/docs/web/data-visualization/line-charts/line-charts-do-readability.png?fit=max&auto=format&n=JOXKXxZG3fxsW6pa&q=85&s=745093ae4e34538abc47e0039791e733" alt="line chart with balanced axises" width="940" height="905" data-path="images/docs/web/data-visualization/line-charts/line-charts-do-readability.png" />
  </DoDont>

  <DoDont type="dont" text="clutter the chart with excessive Y-axis labels that hinder clarity. The example above shows Y-axis labels in increments of 100 (100, 200, 300, and so on). When possible, reduce labels to increase clarity and legibility.">
    <img src="https://mintcdn.com/servicetitan/JOXKXxZG3fxsW6pa/images/docs/web/data-visualization/line-charts/line-charts-dont-readability.png?fit=max&auto=format&n=JOXKXxZG3fxsW6pa&q=85&s=087c68d41d4f328c0fc79c3c312cc01b" alt="line chart without balanced axises" width="944" height="908" data-path="images/docs/web/data-visualization/line-charts/line-charts-dont-readability.png" />
  </DoDont>
</Columns>

<Columns cols={2} className="mb-4">
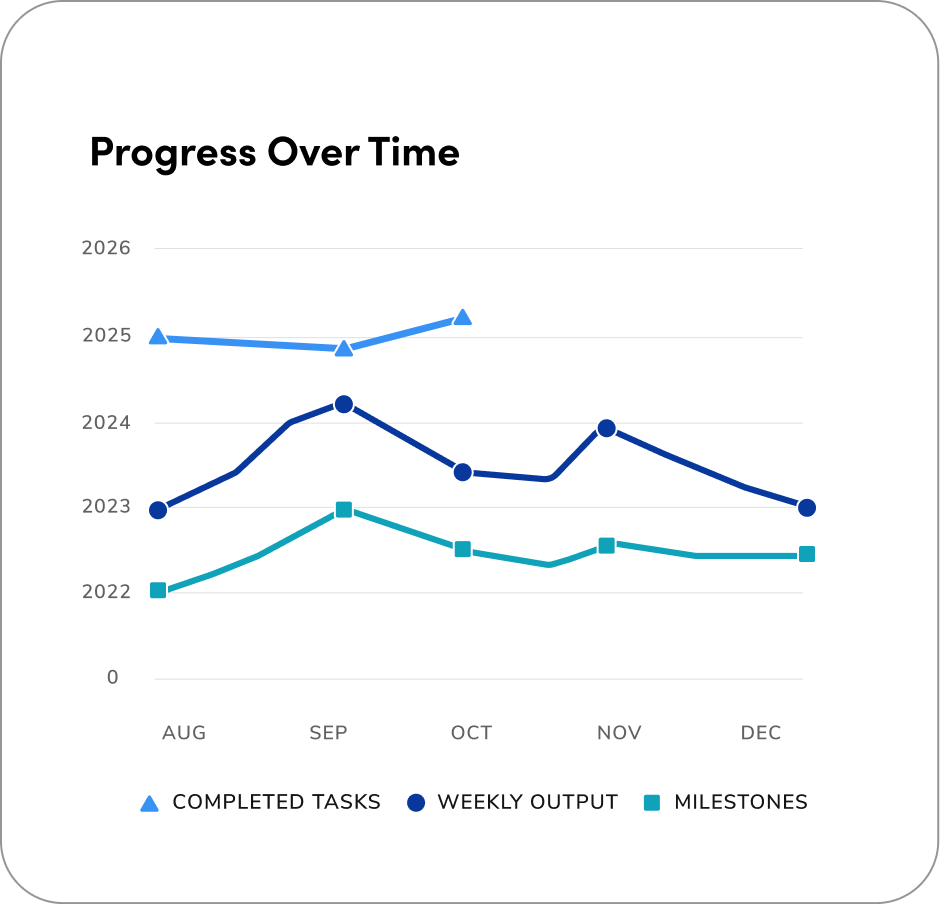
  <DoDont type="do" text="represent the current year's line up to the last available data point, keeping it cut off or partially shown, not extending fully to the end of the year.">
    <img src="https://mintcdn.com/servicetitan/JOXKXxZG3fxsW6pa/images/docs/web/data-visualization/line-charts/line-charts-do-current-year.png?fit=max&auto=format&n=JOXKXxZG3fxsW6pa&q=85&s=18dc79a89ea185b0be2c374a7fdc4f0f" alt="line chart with line ending on the year the data ends" width="940" height="905" data-path="images/docs/web/data-visualization/line-charts/line-charts-do-current-year.png" />
  </DoDont>

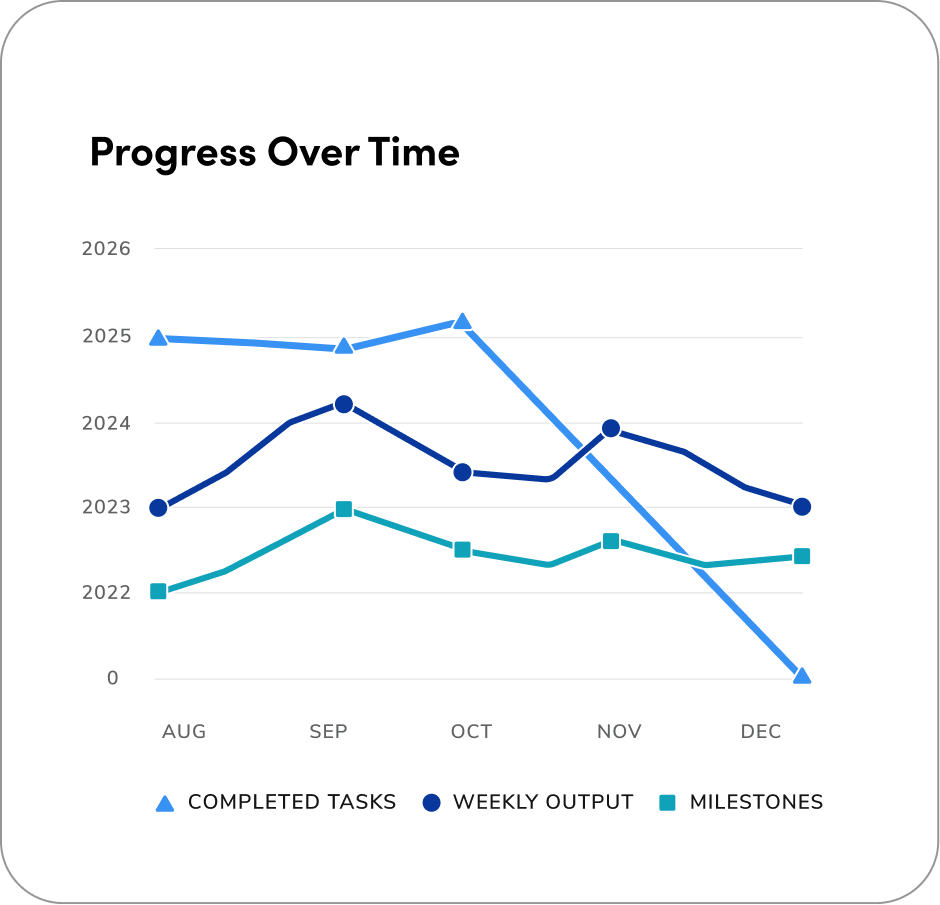
  <DoDont type="dont" text="extend the current year's line fully to the end of the year if data is not yet complete, as this misleadingly suggests that the full year's data is available and potentially distorts the perception of trends or performance.">
    <img src="https://mintcdn.com/servicetitan/JOXKXxZG3fxsW6pa/images/docs/web/data-visualization/line-charts/line-charts-dont-current-year.png?fit=max&auto=format&n=JOXKXxZG3fxsW6pa&q=85&s=644dc3421ed58b2235fc9d0c51ceb506" alt="line chart with line ending on the year the chart ends" width="940" height="905" data-path="images/docs/web/data-visualization/line-charts/line-charts-dont-current-year.png" />
  </DoDont>
</Columns>

<Columns cols={2} className="mb-4">
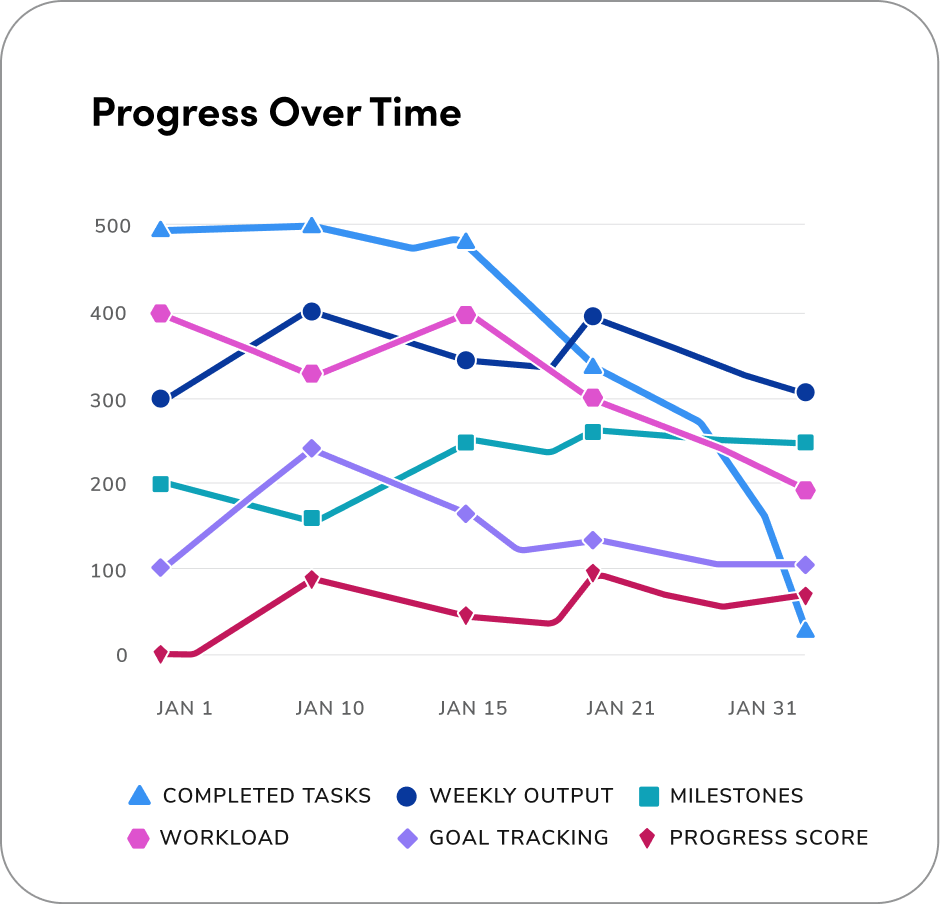
  <DoDont type="do" text="ensure optimal clarity and prevent visual clutter in line charts by limiting variables to no more than 6 total. Please utilize the categorical color palette in its defined order, as specific highlighting is generally not needed when users can access detailed information via hover states.">
    <img src="https://mintcdn.com/servicetitan/JOXKXxZG3fxsW6pa/images/docs/web/data-visualization/line-charts/line-charts-do-clarity.png?fit=max&auto=format&n=JOXKXxZG3fxsW6pa&q=85&s=109a4840cd8ee82f943de25a5f4cb29f" alt="line chart with six variables" width="940" height="905" data-path="images/docs/web/data-visualization/line-charts/line-charts-do-clarity.png" />
  </DoDont>

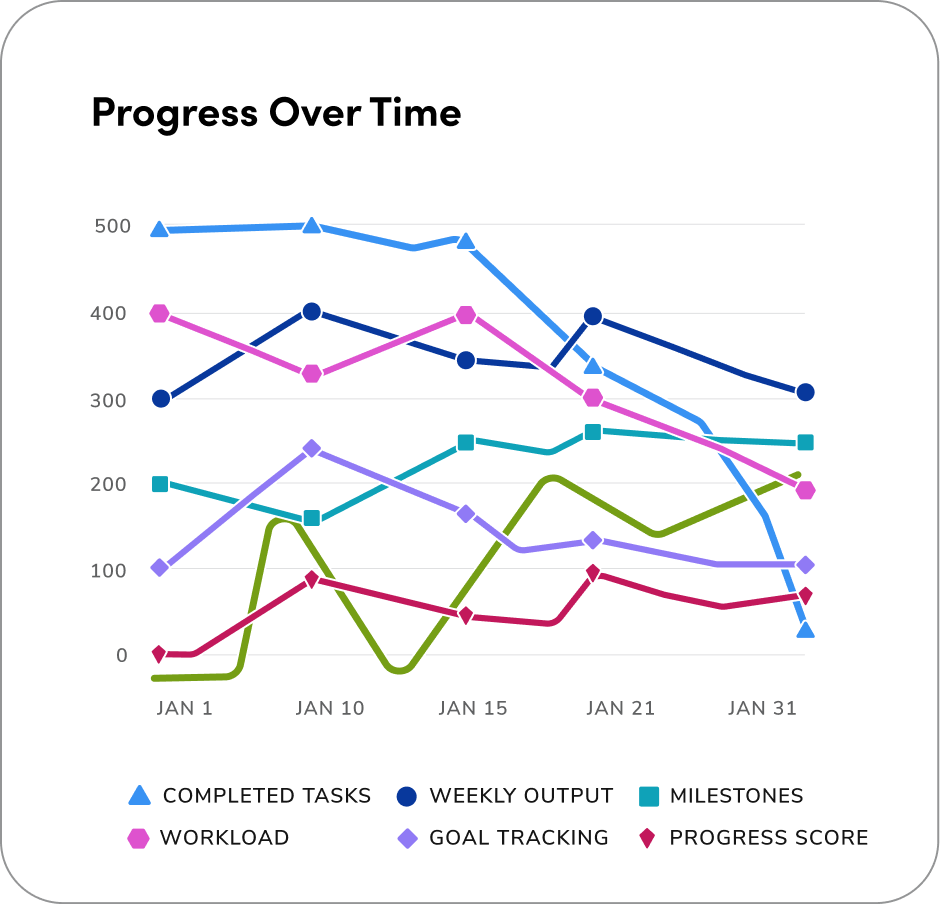
  <DoDont type="dont" text="use more than 6 colors or variables in a line chart. This creates visual clutter, making it hard to distinguish lines and understand the data effectively.">
    <img src="https://mintcdn.com/servicetitan/JOXKXxZG3fxsW6pa/images/docs/web/data-visualization/line-charts/line-charts-dont-clarity.png?fit=max&auto=format&n=JOXKXxZG3fxsW6pa&q=85&s=4974a9164f6ac79a85f9af50bd01831f" alt="line chart with random color choices" width="940" height="905" data-path="images/docs/web/data-visualization/line-charts/line-charts-dont-clarity.png" />
  </DoDont>
</Columns>

## Area of Focus & Hover States

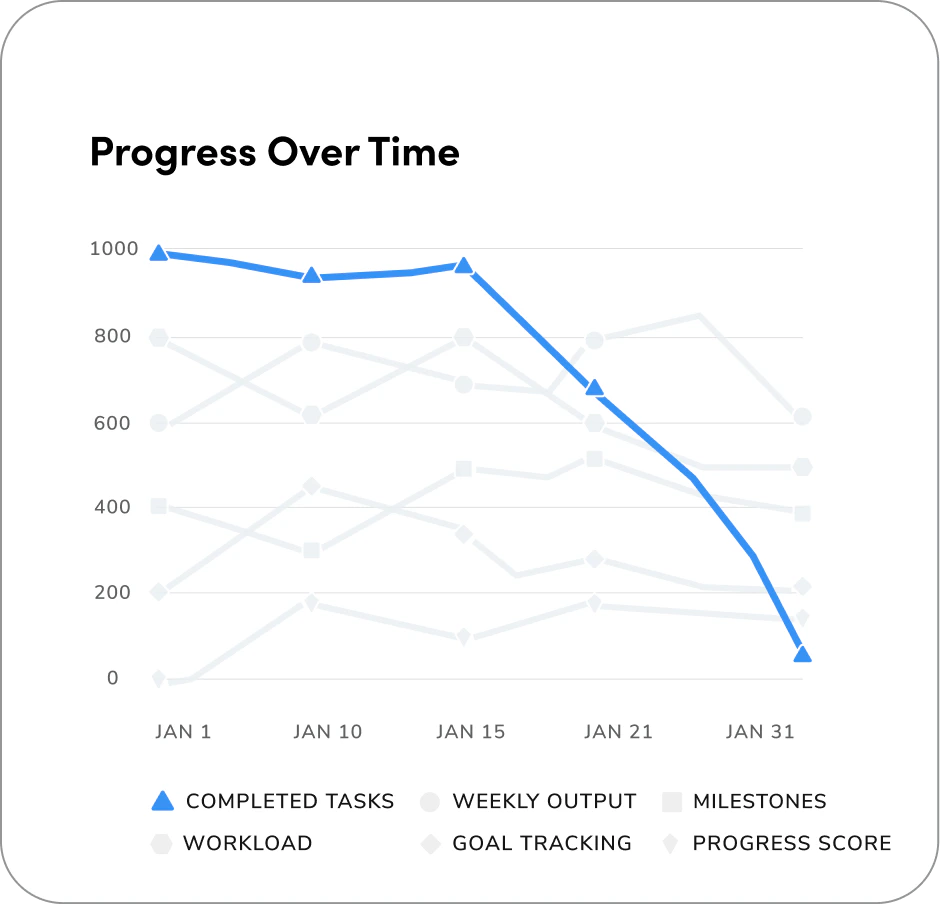
Below is an example of Area of Focus charts that use subtle emphasis of color to highlight key data without losing overall context.

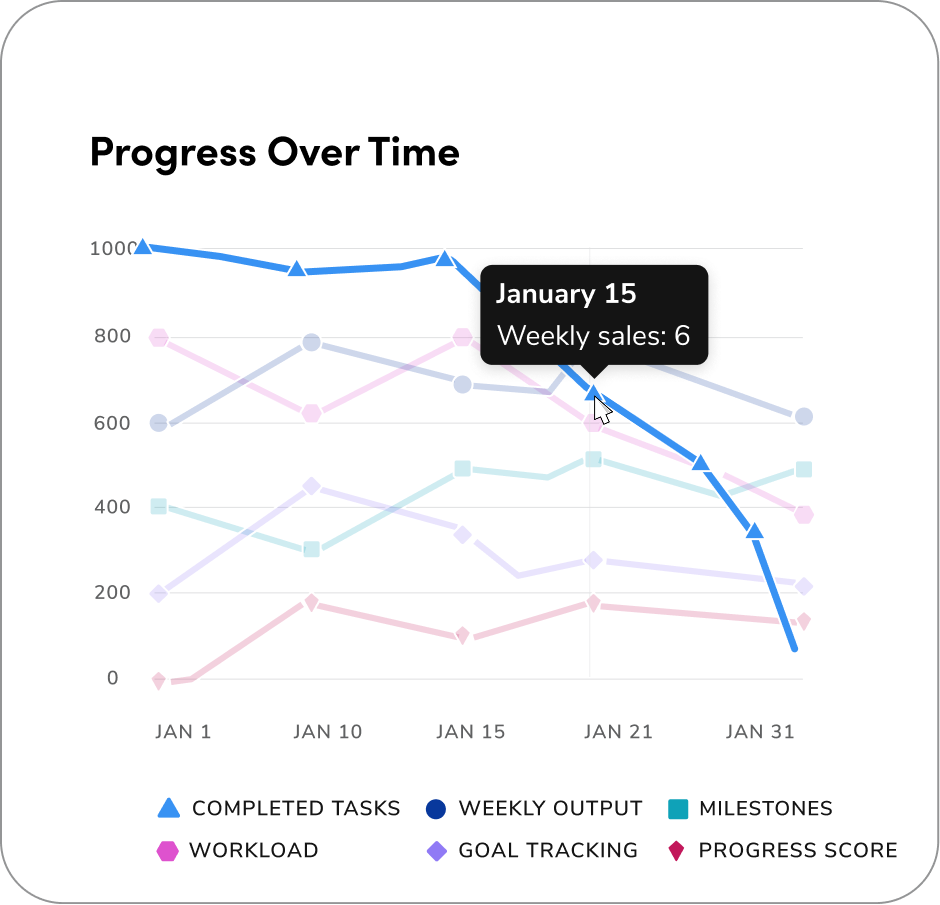
<Note>In contrast, hover states apply stronger, interactive visual changes to indicate active user engagement and selection.</Note>

### Area of Focus

To highlight a single variable, use the default blue for the focused variable and grey 600 for all others. In this scenario, there should be no cursor for the area of focus, this represents a focus state, not a hover interaction.

### Hover State

When in [hover states](/docs/web/data-visualization/accessibility#hover-states), set all non-hovered elements to 20% opacity to keep focus on the highlighted data point, and use Anvil's [Tooltip component](/docs/web/components/tooltip/design) to display the value/label on hover.

<Columns cols={2}>
  <div className="flex flex-col gap-4">
    <img src="https://mintcdn.com/servicetitan/7ob8rxQFEm423LLy/images/docs/web/data-visualization/line-charts/line-charts-area-of-focus.png?fit=max&auto=format&n=7ob8rxQFEm423LLy&q=85&s=6af8027aa597f19b51e3416c30f4f857" alt="Line chart with the highlighted line" width="940" height="905" data-path="images/docs/web/data-visualization/line-charts/line-charts-area-of-focus.png" />
  </div>

  <div className="flex flex-col gap-4">
    <img src="https://mintcdn.com/servicetitan/H6IrrYy_BHqQ84Cc/images/docs/web/data-visualization/line-charts/line-charts-hover.png?fit=max&auto=format&n=H6IrrYy_BHqQ84Cc&q=85&s=df515257f41da32b5e98ea8f5f3cb9a3" alt="Line chart with the highlighted line with a hover state" width="940" height="905" data-path="images/docs/web/data-visualization/line-charts/line-charts-hover.png" />
  </div>
</Columns>

## Keep the Content Consistent

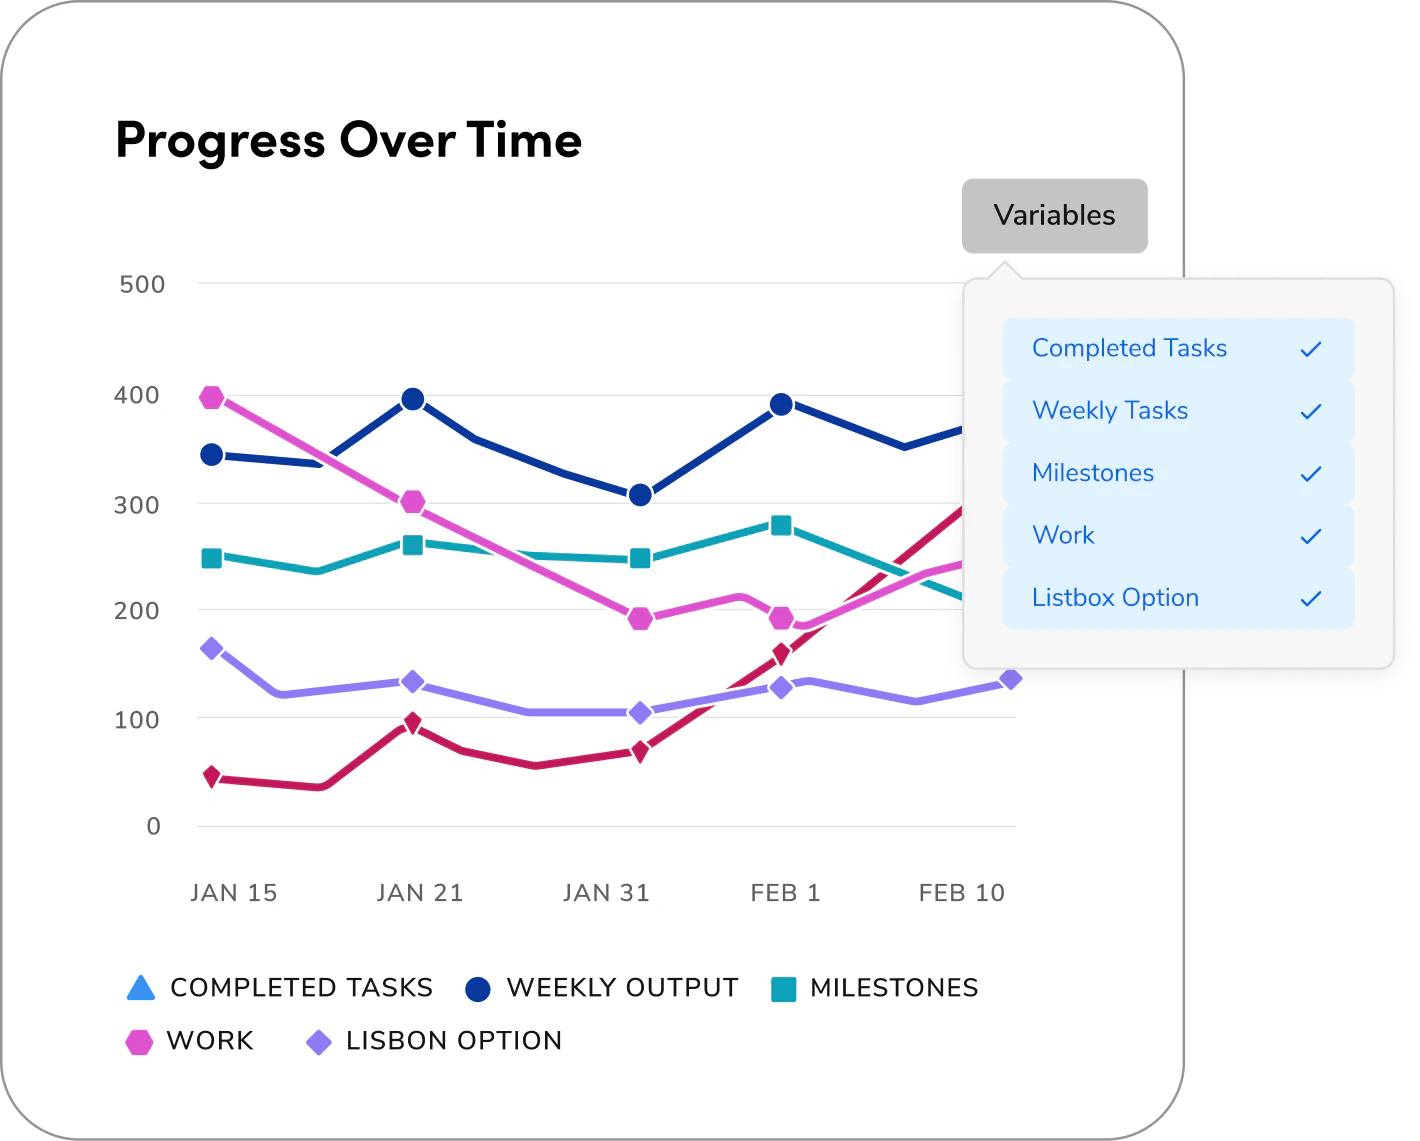
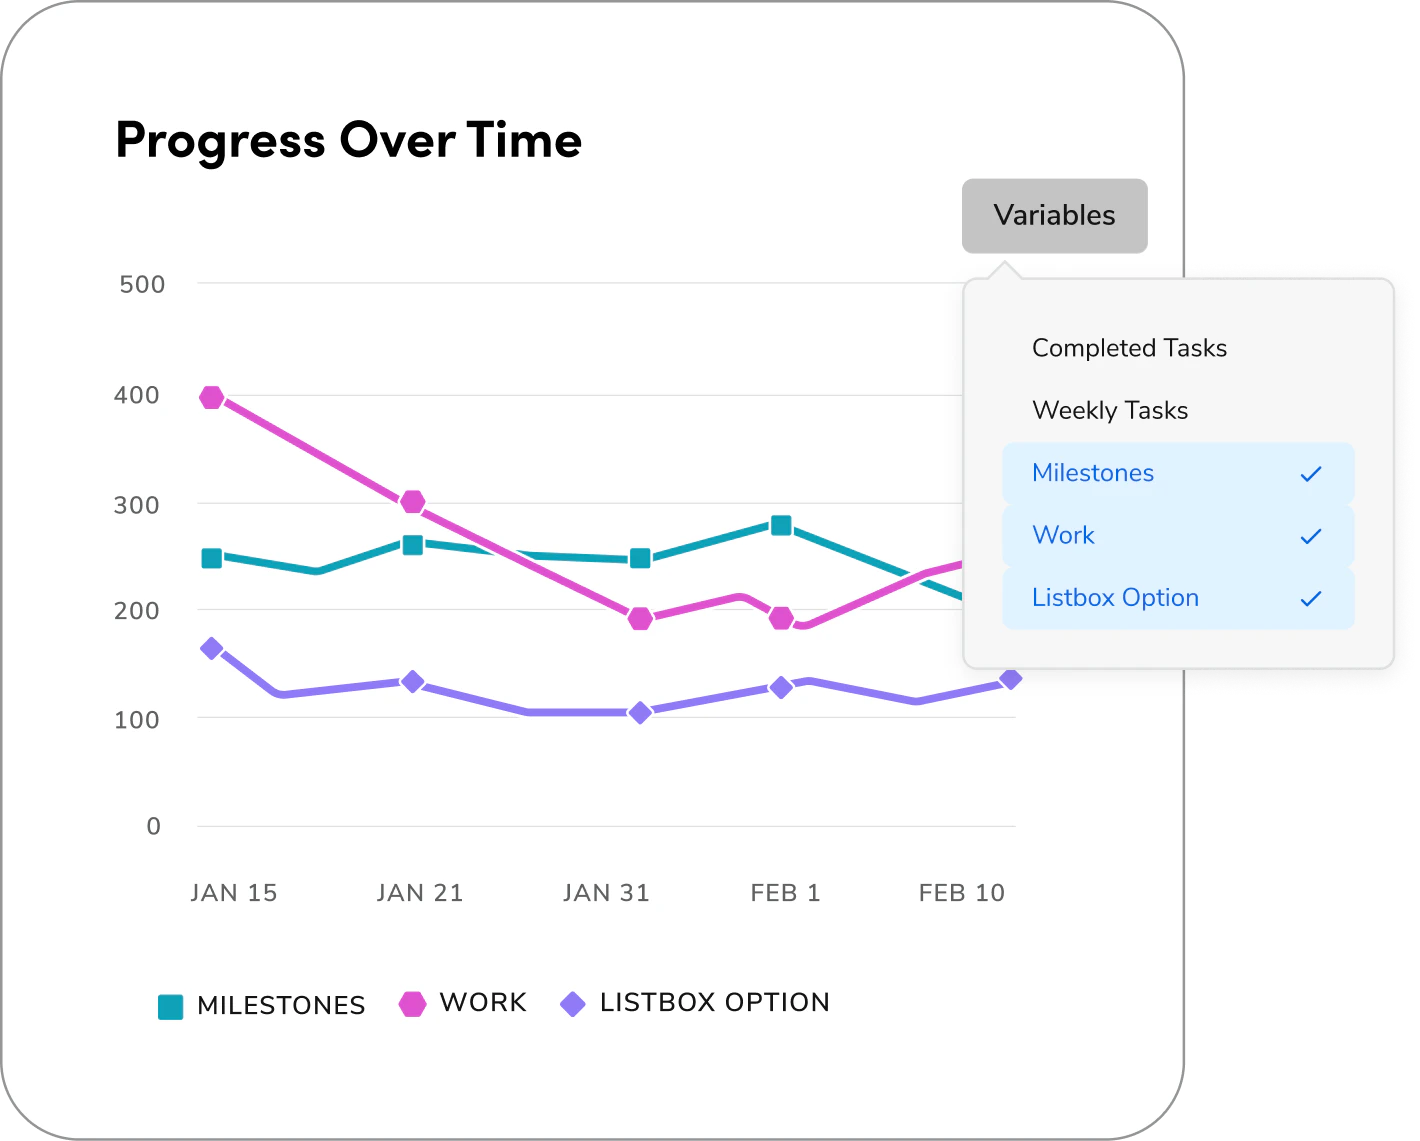
On the “Progress Over Time January” line chart below, the viewer can toggle six variables.  To ensure each variable keeps its assigned color when toggled: turning a variable off should only hide it, not reassign or shift colors among the remaining series.

For example, if Completed Tasks is unchecked, its color remains reserved so the visible lines, legend, and visual mapping stay stable.  Do not change the styling or reassign colors (for example, altering color, stroke, or pattern).

<Columns cols={2} className="mb-4">
  <Card>
    <div className="flex flex-col gap-4 items-center justify-center">
      <Badge color="green">All checked variables are visible</Badge>

      <img src="https://mintcdn.com/servicetitan/7ob8rxQFEm423LLy/images/docs/web/data-visualization/line-charts/line-charts-progress-over-time-all.png?fit=max&auto=format&n=7ob8rxQFEm423LLy&q=85&s=d0cc3173e89005f5cb04c1ddd1bb6077" alt="Line chart with the highlighted line with a hover state" width="1420" height="1141" data-path="images/docs/web/data-visualization/line-charts/line-charts-progress-over-time-all.png" />
    </div>
  </Card>

  <Card>
    <div className="flex flex-col gap-4 items-center justify-center">
      <Badge>Unchecked, one variable</Badge>

      <img src="https://mintcdn.com/servicetitan/7ob8rxQFEm423LLy/images/docs/web/data-visualization/line-charts/line-charts-progress-over-time-partial.png?fit=max&auto=format&n=7ob8rxQFEm423LLy&q=85&s=941b2f302eebade6673fb9a36ec4921c" alt="Line chart with the highlighted line with a hover state" width="1420" height="1141" data-path="images/docs/web/data-visualization/line-charts/line-charts-progress-over-time-partial.png" />
    </div>
  </Card>
</Columns>

<Card title="Questions? Challenges?" icon="link" href="https://servicetitan.enterprise.slack.com/archives/C0881LFTGDR" arrow="true" cta="Click here">
  Contact the Visual Design team on the #ask-vizd channel
</Card>